Figures & data
Figure 1. Experimental procedure for low-dose-rate low dose radiation (LDR) in a mouse model of Alzheimer’s disease. (A) Schematic illustration of LDR exposure in 5xFAD mice. (B) Schematic diagram of experimental procedures with wild-type (WT) and 5xFAD (TG) mice.
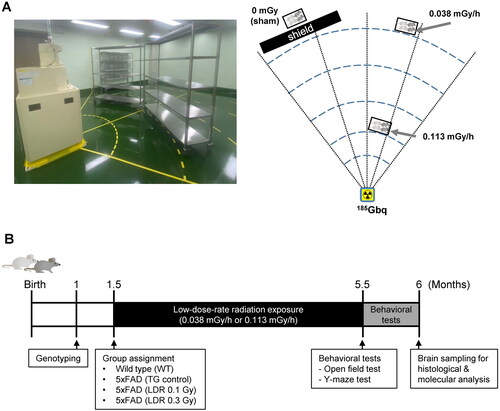
Table 1. Primer used in real-time RT-PCR analysis.
Figure 2. Locomotor activity and non-spatial memory in 5xFAD mice following low-dose-rate low dose radiation (LDR). (A) Velocity, (B) activity, (C) total distance, and (D) time in center on open field apparatus were assessed in wild-type (WT) and 5xFAD (TG) mice with or without LDR. (E) Number of entries, (F) % of spontaneous alternation (SAP) in Y-maze test were assessed in WT and TG groups. Data are expressed as means ± SE (n = 7 per group).
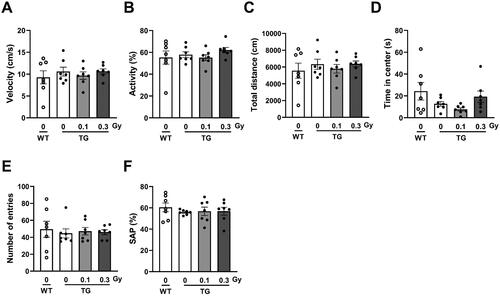
Figure 3. Effect of low-dose-rate low dose radiation (LDR) on amyloid beta (Aβ) deposition and APP processing in 5xFAD mice. (A) Representative immunostaining images of Aβ deposits (in brown) in the brain of 5xFAD (TG) mice with or without LDR. (B) Quantification of Aβ burden in the hippocampus and cortex of TG + 0 Gy (sham), TG + 0.1 Gy, and TG + 0.3 Gy (n = 5/group). (C) Representative Western blots of 6E10 in the cortex and hippocampus of 5xFAD mice. (D) Quantification of APP and CTFβ expression in lysates for the indicated groups. (E) The bar graphs show the relative expression levels of insulin-degrading enzyme (IDE) and neprilysin (NEP) in cortex of mice brain. Data are expressed as means ± SEM [n = 4 for (D), n = 6 for (E)]. *p < 0.05, **p < 0.01 and ***p < 0.001 vs. WT group. ns: not significant.
![Figure 3. Effect of low-dose-rate low dose radiation (LDR) on amyloid beta (Aβ) deposition and APP processing in 5xFAD mice. (A) Representative immunostaining images of Aβ deposits (in brown) in the brain of 5xFAD (TG) mice with or without LDR. (B) Quantification of Aβ burden in the hippocampus and cortex of TG + 0 Gy (sham), TG + 0.1 Gy, and TG + 0.3 Gy (n = 5/group). (C) Representative Western blots of 6E10 in the cortex and hippocampus of 5xFAD mice. (D) Quantification of APP and CTFβ expression in lysates for the indicated groups. (E) The bar graphs show the relative expression levels of insulin-degrading enzyme (IDE) and neprilysin (NEP) in cortex of mice brain. Data are expressed as means ± SEM [n = 4 for (D), n = 6 for (E)]. *p < 0.05, **p < 0.01 and ***p < 0.001 vs. WT group. ns: not significant.](/cms/asset/fbfbb0c5-fb2d-454d-bb1d-d5a1d5631f8a/irab_a_2211142_f0003_c.jpg)
Figure 4. Analysis of neuroinflammation-related signaling in 5xFAD mice following low-dose-rate low dose radiation (LDR). (A) Representative Western blots of GFAP and Iba1 in the cortex and hippocampus of 5xFAD mice. (B, C) Quantification of GFAP and Iba1 expression in lysates for the indicated groups. (D) The bar graphs show the mRNA expression levels of Iba1 and Gfap. (E) The bar graphs show the inflammatory cytokines (IL-1β, IL-6, TNF-α, and IFN-γ). Data are expressed as means ± SEM [n = 4 for (B,C), n = 6 for (D,E)]. *p < 0.05, **p < 0.01 and ***p < 0.001 vs. WT group or TG (0 Gy) group. ns: not significant.
![Figure 4. Analysis of neuroinflammation-related signaling in 5xFAD mice following low-dose-rate low dose radiation (LDR). (A) Representative Western blots of GFAP and Iba1 in the cortex and hippocampus of 5xFAD mice. (B, C) Quantification of GFAP and Iba1 expression in lysates for the indicated groups. (D) The bar graphs show the mRNA expression levels of Iba1 and Gfap. (E) The bar graphs show the inflammatory cytokines (IL-1β, IL-6, TNF-α, and IFN-γ). Data are expressed as means ± SEM [n = 4 for (B,C), n = 6 for (D,E)]. *p < 0.05, **p < 0.01 and ***p < 0.001 vs. WT group or TG (0 Gy) group. ns: not significant.](/cms/asset/56c773f5-4c06-4e53-9fc3-9efccf1283db/irab_a_2211142_f0004_b.jpg)
Figure 5. Analysis of genes related with IFN signaling in 5xFAD mice following low-dose-rate low dose radiation (LDR). The bar graphs show the relative expression levels of (A) Cxcl10, (B) Rsad2, (C) Usp18, and (D) Ifitm3 in cortex of mice brain. Data are expressed as means ± SEM (n = 6 per group). *p < 0.05, **p < 0.01 and ***p < 0.001 vs. WT group or TG (0 Gy) group. ns: not significant.
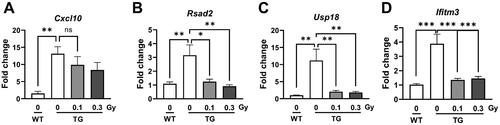
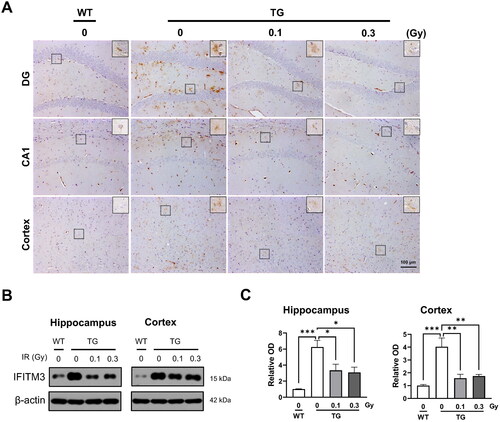
Figure 6. Effect of low-dose-rate low dose radiation (LDR) exposure on IFITM3 in 5xFAD mice. (A) Representative immunostaining images of IFITM3 (in brown) in the brain of wild-type (WT) and 5xFAD (TG) mice with or without LDR. The square shows the merged images at higher magnification (Inserted panel). (B) Representative Western blots of IFITM3 in the cortex and hippocampus of 5xFAD mice. (C) Quantification of IFITM3 expression in lysates for the indicated groups. (D) The bar graphs show the relative expression levels of IFITM3. Data are expressed as means ± SEM (n = 4 per group). *p < 0.05, **p < 0.01 and ***p < 0.001 vs. WT group or TG (0 Gy) group.