Figures & data
Table 1. Microarray datasets studied.
Figure 1. Differentially expressed (DE) genes after low- and high-dose IR exposures. A: Venn diagram of the DE genes. B: the percentages of identified DE genes that Overlapped with known functional databases. C: top 5 bioprocesses (biological process), KEGG (Kyoto Encyclopdia of genes and Genomes), and Wiki (Wikipedia) pathways enriched in DE genes after low-dose IR exposure. D: top 5 biological process, KEGG and Wiki pathways enriched in DE genes after high-dose IR exposure.
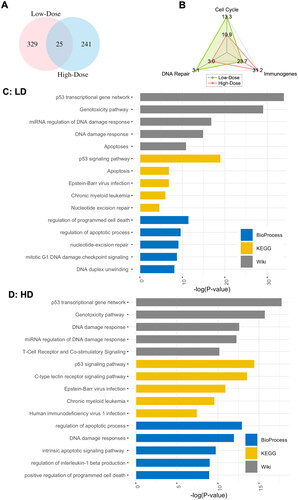
Figure 2. DE genes with known cell-cycle phases and checkpoint functions, where genes in red are upregulated with a positive and genes in blue are down-Regulated with a negative
A: Cell cycle related DE genes after high-dose IR exposure (GSE8917). B: Cell cycle associated DE genes after low-dose IR exposure (GSE43151).
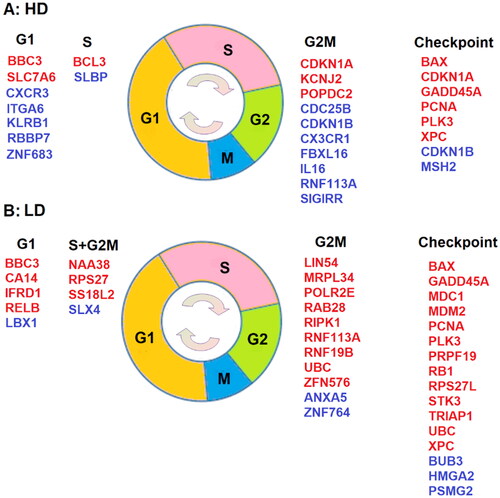
Figure 3. Average log-fold changes (LFC) of the DE genes in each cluster over time and dose DE genes are divided into 4 clusters with the sign of and
where cluster I (C1) contains DE genes with
and
oth being positive (+ +); cluster 2 (C2) consists of DE genes with positive
but negative
(+ -); cluster 3 (C3) comprises DE genes with negative
but positive
(- +); and cluster 4 (C4) includes DE genes with
and
both being negative (- -). A: the 4 clusters after high-dose (HD) IR exposure. B: the 4 clusters after low-dose (LD) IR exposure. From left to right, columns 1 and 3 are the 3D plots for LFC vs both dose and time course, while columns 2 and 4 are the marginal 2D plots for LFC against dose and time, separately.
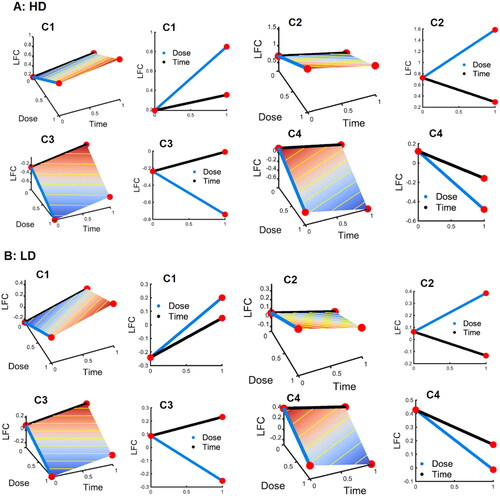
Figure 4. Pie charts showing the percentage of DE genes in different clusters and the KEGG pathway enrichment analysis for genes in clusters C1 ( > 0 &
> 0) and C4 (
< 0 &
< 0) following low- and high-dose IR exposures. LD-C1: Top 5 KEGG (Kyoto Encyclopedia of genes and Genomes) pathways for upregulated genes dose IR exposure; and HD-C1: Top 5 KEGG pathways for upregulated genes in C1 after a high-dose IR exposure. There is no KEGG pathway enriched for downregulated genes in LD-C4.
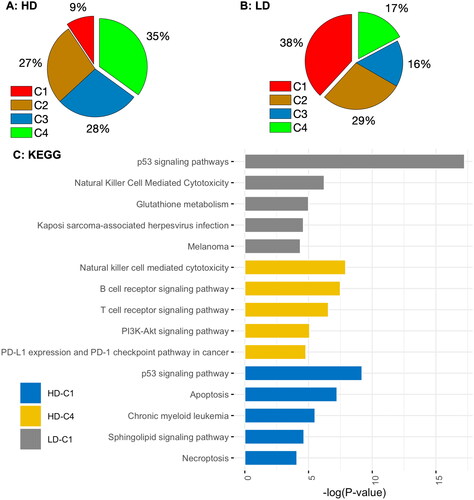
Table 2. Common DE genes over high- and low-dose IR exposure.
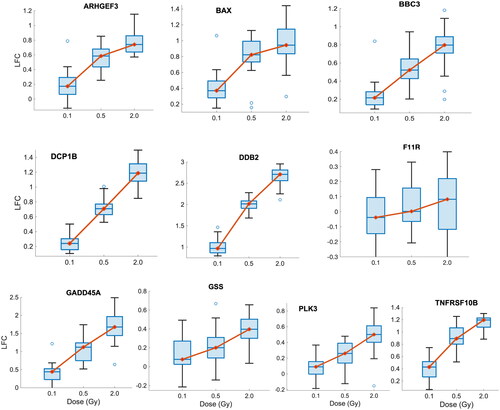
Figure 5. Boxplots of the LFC of 10 candidate biomarkers following different doses of IR exposure (0.1 Gy, 0.5 Gy, and 2 Gy) in the validation dataset (GSE23515). the y-Axis represents LFC. The red dot and the horizontal line inside each box represent the median.