Figures & data
Table 1. Example of the use case for an intervention provided to the participants.
Table 2. Topics identified in the bachelor students focus group (N = 5).
Table 3. Topics identified in the PhD students focus group (N = 6).
Table 4. Topics identified in the teachers focus group (N = 4).
Table 5. Topics identified in the professional development staff focus group (N = 6).
Table 6. Topics identified in the writing researchers focus group (N = 4).
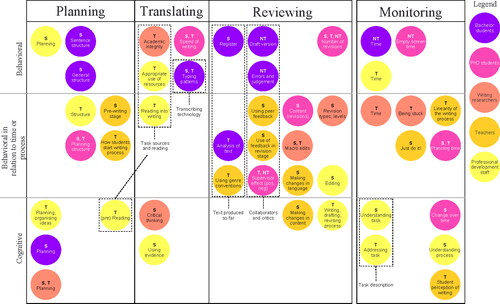
Figure 1. Overview of the topics of desired indicators discussed by all stakeholders.
Notes. Topics are mapped to the process they address in Flower and Hayes’ (1981) model of writing processes (x-axis) and level of the indicators (behavioral versus cognitive; y-axis). Topics related to concepts in the writing environment (Hayes, Citation2012) are grouped in the rectangular boxes. Letters in the circles (T = teacher, S = student, NT = not teacher) indicate the stakeholders who should have access to these data.