Figures & data
Table 1. Summary of oligochaete worm-related research: worm species, reactor design and important findings.
Table 2. FEEMS excitation and emission wave length regions with the associated substances.
Table 3. Solids reduction of activated sludge for worm predated (WP) and endogenous respirated (ER) sludges.
Table 4. Average rates for WP and ER.
Table 5. EPS extraction data of waste activated (WAS), endogenous respirated (ER) and worm predated (WP) sludges, after a 4-day batch incubation.
Table 6. ALE polysaccharide concentrations for WAS, endogenous respirated (ER) and worm predated (WP) sludges after 4 day batch incubation of 2 separate batches.
Figure 1. Normalized PSD of treated sludges, showing the averages of triplicate measurements. Graph split in two parts: (a) 30–200 µm; (b) 2–30 µm. Error bars are omitted for clarity. Horizontal line around 0.5 counts/mL*µm is due to low particle counts (1–2 counts/mL) in the measurements. The outlier at 1.6 µm* is probably due to a fault in the machine as it is consistent in all the measurements. Particles larger than 200 µm were not observed in the sludges. Batch VS reduction was for WP 42%, ER 18% and ER-30 29%. For visualization, the values plotted were not multiplied by the dilution factor.
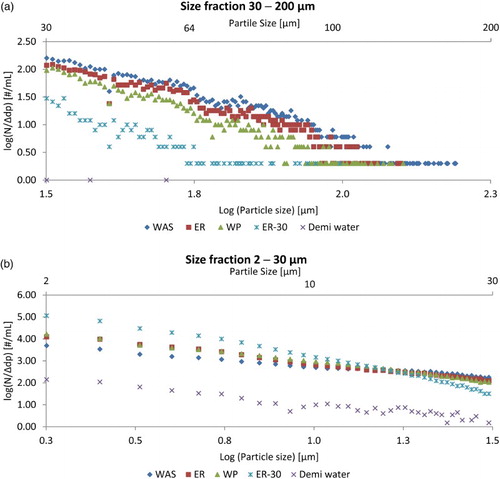
Table 7. Turbidity and triplicate particle counting measurements of water phase of 30 min settled waste activated (WAS), endogenous respirated (ER), worm predated (WP), 30-day extended aerated (ER-30) sludges and demineralized water (demi water).
Figure 2. Change in average SVI over the duration of the batch for endogenous respirated (ER) and worm predated (WP) sludges. Averaged values of 4 batches. Error bars represent standard deviations. Averaged VS reduction percentages were 40% ± 16 and 8% ± 3 for WP and ER, respectively. The data point at day 4 was from one batch only.
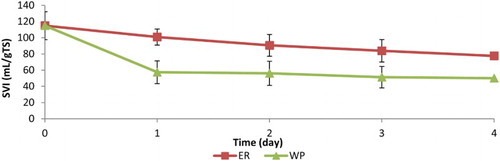
Figure 3. Change in sludge blanket volume versus settling time for WAS, endogenous respirated (ER) and worm predated (WP) sludges. Results are from a 3-day batch experiment with VS reduction of 63% ± 3 and 13% ± 3 for WP and ER, respectively, using a worm/VS ratio of 15 g/g.
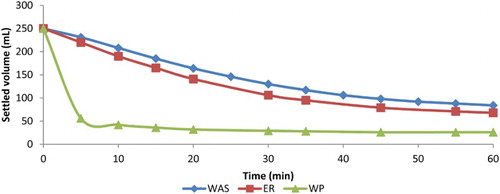
Table 8. Protein and carbohydrate fractions of dissolved COD in batch supernatants of waste activated (WAS), endogenous respirated (ER), worm predated (WP) and 30-day extended aerated (ER-30) sludges.
Figure 4. EEMS spectra of waste activated (WAS), endogenous respirated (ER) and worm predated (WP) sludges, respectively. Measurements were done in triplicate. The plots are representative off the triplicates. VS degradation percentages of the samples were the following: ER 16%; WP 24%.
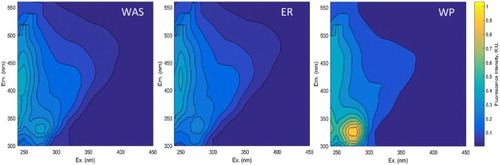
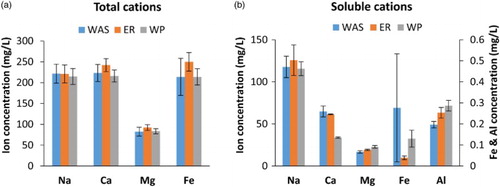
Figure 5. (a) Total and (b) dissolved cations for AS, ER and WP. Averaged results from 2 batches. Error bars represent the upper and lower value of the duplicate measurement. For Al3+ only the soluble fraction was measured. Average VS reduction was 10% and 35% for ER and WP, respectively.