Figures & data
Table 1. Data variables and sources.
Table 2. Number and Variety of Non-Domestic Properties in Case Study Samples.
Figure 1. Edinburgh: shop standard directional ellipses 2000–2017.
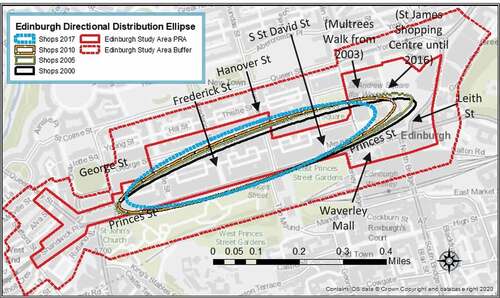
figure 2. Glasgow: shop standard directional ellipses 2000–2017.
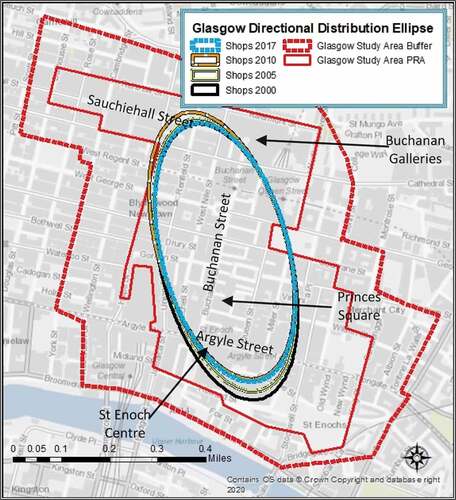
Figure 3. Nottingham: shop standard directional ellipses 2000–2017.
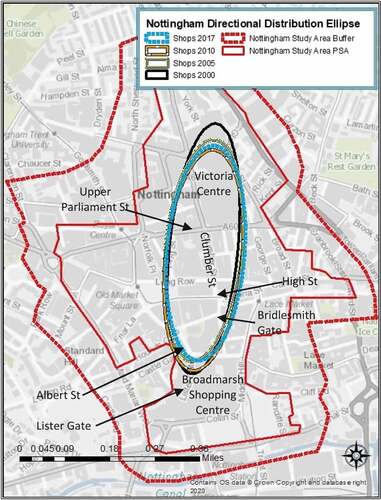
Figure 4. Hull: Shop standard directional ellipses 2000–2017.
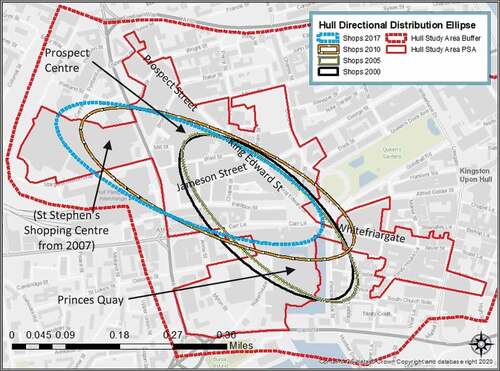
Figure 5. Liverpool: Shop standard directional ellipses 2000–2017.
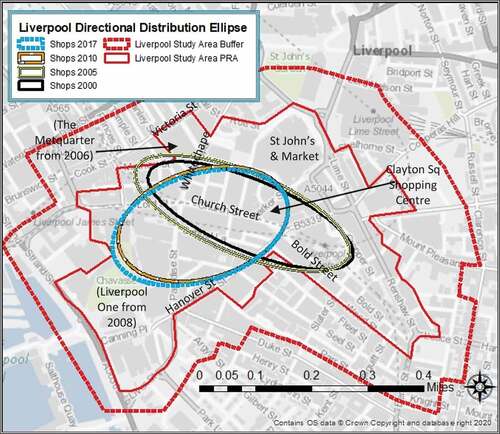
Figure 6. Spatial analysis of shops (weighted by Rateable Value per square ITZA) in Edinburgh’s PRA.
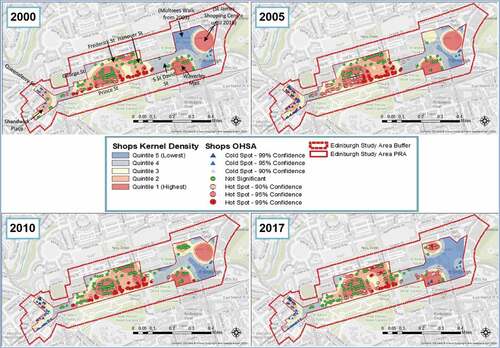
Figure 7. Spatial analysis of shops (weighted by Rateable Value per square ITZA) in Glasgow’s PRA.
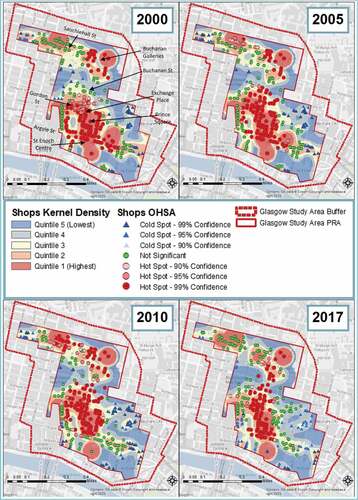
Figure 8. Spatial analysis of shops (weighted by Rateable Value per square ITZA) in Nottingham’s PSA.
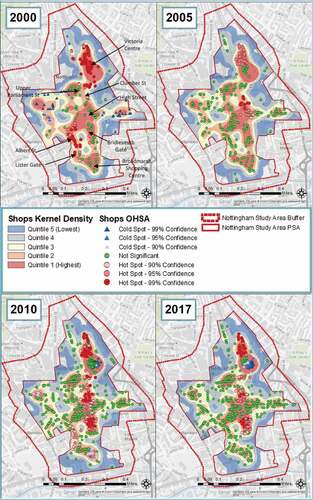
Figure 9. Spatial analysis of shops (weighted by Rateable Value per square ITZA) in Hull’s PSA.
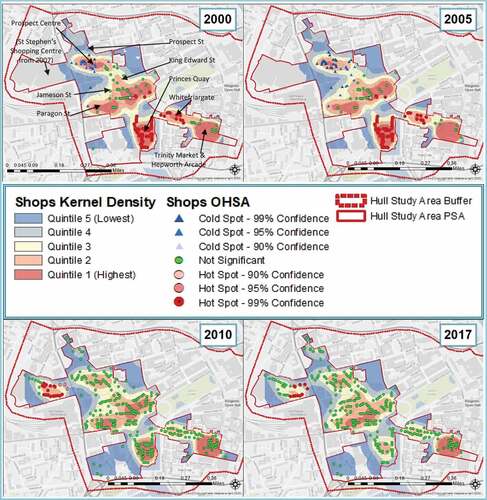
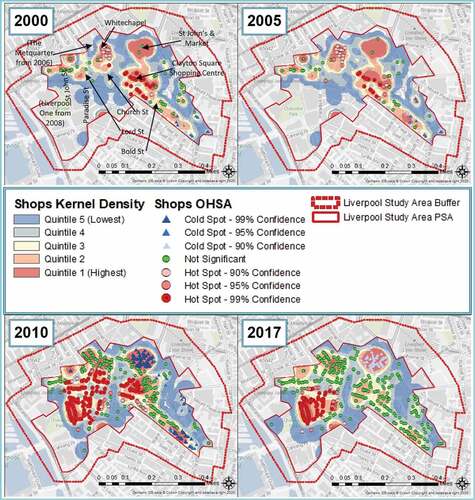
Figure 10. Spatial analysis of shops (weighted by Rateable Value per square ITZA) in Liverpool’s PSA.