
Figures & data
Figure 1. A screenshot of the navigation task indicating one of the eight landmarks in the environment.
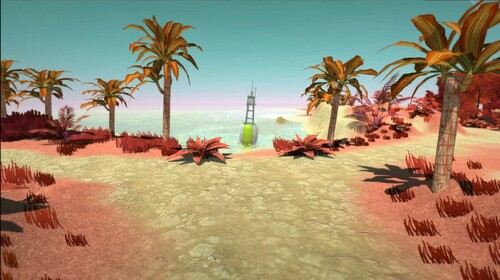
Table 1. Demographics of ABI patients and sample of pre and post-matched healthy controls.
Table 2. Overview of subjective navigation impairments within subcategories of the ABI population.
Figure 2. Scores on the subscales of the Wayfinding questionnaire. Error bars represent standard error of the mean. * Indicates a significant difference between the control and ABI populations.
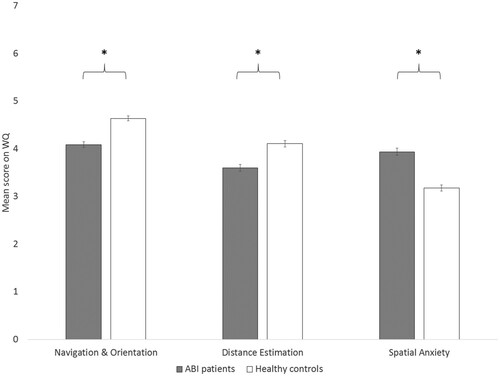
Table 3. Comparison of objective navigation impairment between the control and ABI population.
Table 4. Overview of objective navigation score for the 5 subtasks per brain injury type, onset time and location of brain injury.