
Figures & data
Figure 1. Flow chart of the recruitment and randomization procedure.
Figure showing a vertical flow chart illustrating the number and allocation of participants to the groups from randomization to the analysis phase.
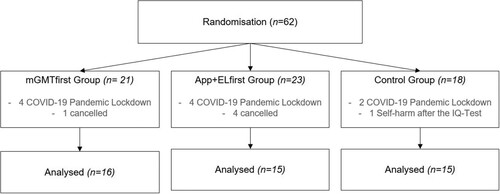
Table 1. Demographic and clinical characteristics of participants.
Figure 2. Study design.
Figure showing a horizontal flowchart depicting the Cross-Over Study design. On the left side, there is “Participants Enrolled” and “Randomization” Following this, there are three branches: “mGMTfirstGroup”, “App+ELfirstGroup”, and “control group”. On each branch following the respective interventions. Below, the phases and measurement time points are listed.
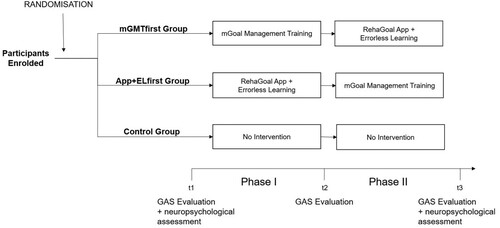
Figure 3. GAS measurements at T1, T2, and T3 for the mGMTfirst Group.
Figure showing a vertical flowchart presenting the three GAS measurement time points and the corresponding practiced status for both tasks within the mGMTfirst Group. The chart highlights the progression of the tasks and practiced status between measurements.
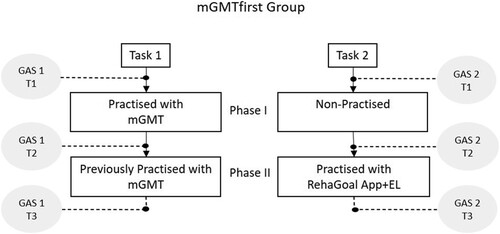
Figure 4. GAS measurements at T1, T2, and T3 for the App+ELfirst Group.
Figure showing a vertical flowchart presenting the three GAS measurement time points and the corresponding practiced status for both tasks within the App+ELfirst Group. The chart highlights the progression of the tasks and practiced status between measurements.
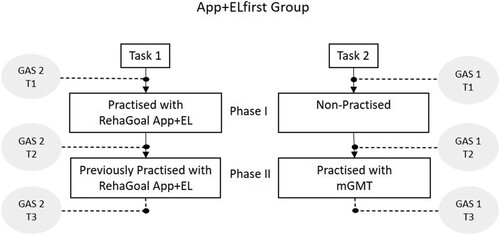
Table 2. Procedures for both intervention sessions.
Table 3. Secondary outcome measures.
Table 4. Pairwise comparison of performance in GAS.
Table 5. Mean GAS scores for each group at three measurement Ttme points (T1, T2, T3).
Figure 5. Comparison of Tower of London mean scores at T1 and T3 for the three groups.
A graph depicting Tower of London mean scores with T1 and T3 on the horizontal axis and mean scores on the vertical axis. Two ascending lines represent the intervention groups, while a slightly descending line represents the control group within the measurement points.
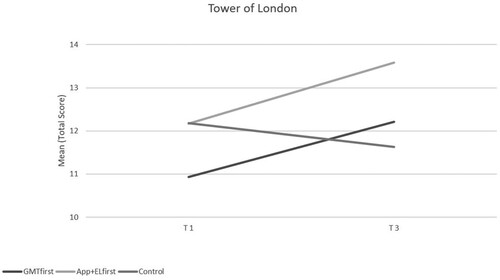
Table 6. Mean neuropsychological test scores for the three groups.