1,153
Views
13
CrossRef citations to date
0
Altmetric
Papers

Analysis of a novel field dilution method for testing samples that exceed the analytic range of point-of-care blood lead analyzers

, , , , , , , & show all
Pages 418-428 | Received 04 Mar 2013, Accepted 14 Aug 2013, Published online: 25 Nov 2013

Figures & data

Figure 1. Field LCII vs. ICP-MS values with ±10% error bounds from ICP-MS results*. Triangle: Field LCII vs. ICP-MS values. Dashed lines: ±10% of ICP-MS value. Note: *One point is excluded from this chart for the sake of clarity. It had an ICP-MS result of 286 µg/dL with a Field LCII result of 262.5 µg/dL. This value was within ±10% of the ICP-MS values.
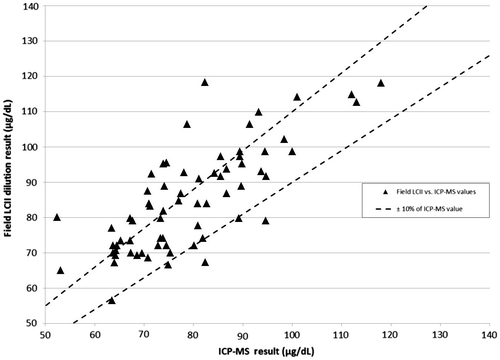
Figure 1. Field LCII vs. ICP-MS values with ±10% error bounds from ICP-MS results*. Triangle: Field LCII vs. ICP-MS values. Dashed lines: ±10% of ICP-MS value. Note: *One point is excluded from this chart for the sake of clarity. It had an ICP-MS result of 286 µg/dL with a Field LCII result of 262.5 µg/dL. This value was within ±10% of the ICP-MS values.

Figure 2. Difference between Field LCII and ICP-MS value as measured against ICP-MS*: Triangle: Field LCII-ICP-MS value. Dashed lines: 95% Level of agreement (−14.6, +25.7). Dot-dash line: Average difference Field LCII – ICP-MS (+5.5). Note: *One point is excluded from this chart as it appeared to be a reporting error. This point had an ICP-MS result of 694 µg/dL with a bias of −234.1.
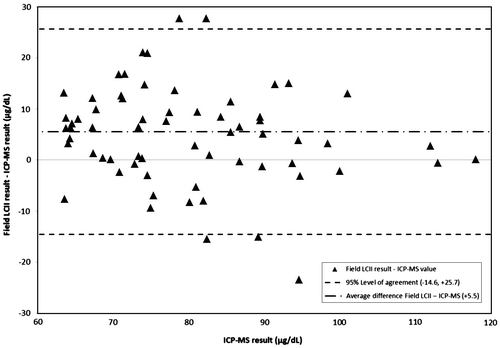
Figure 2. Difference between Field LCII and ICP-MS value as measured against ICP-MS*: Triangle: Field LCII-ICP-MS value. Dashed lines: 95% Level of agreement (−14.6, +25.7). Dot-dash line: Average difference Field LCII – ICP-MS (+5.5). Note: *One point is excluded from this chart as it appeared to be a reporting error. This point had an ICP-MS result of 694 µg/dL with a bias of −234.1.

Figure 3. CDC LCII vs. ICP-MS values with ±10% error bounds from ICP-MS results. Triangle: CDC LCII vs. ICP-MS values. Dashed lines: ±10% of ICP-MS value.
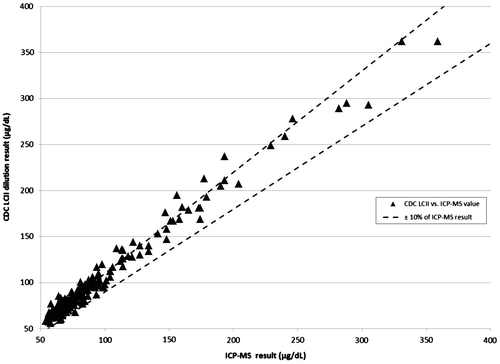
Figure 3. CDC LCII vs. ICP-MS values with ±10% error bounds from ICP-MS results. Triangle: CDC LCII vs. ICP-MS values. Dashed lines: ±10% of ICP-MS value.

Figure 4. Difference between CDC LCII and ICP-MS value as measured against ICP-MS. Triangle: Field LCII-ICP-MS value. Dashed lines: 95% Level of agreement (−7.9, +23.5). Dot-dash line: Average difference Field LCII – ICP-MS (+7.8).
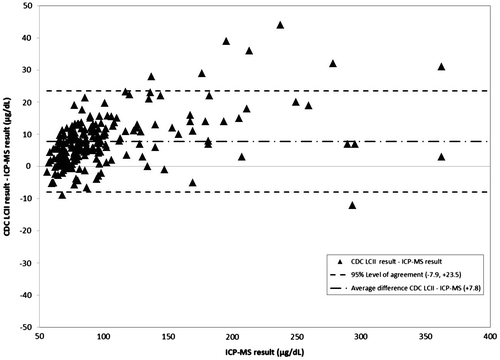
Figure 4. Difference between CDC LCII and ICP-MS value as measured against ICP-MS. Triangle: Field LCII-ICP-MS value. Dashed lines: 95% Level of agreement (−7.9, +23.5). Dot-dash line: Average difference Field LCII – ICP-MS (+7.8).

Table 1. CCC results comparing each site vs. ICP-MS as well as to each other.

Table 2. Number and percent of CDC and Field LCII dilution procedure values within ±10% of the ICP-MS value by ICP-MS quartile.

Reprints and Corporate Permissions

Please note: Selecting permissions does not provide access to the full text of the article, please see our help page How do I view content?

To request a reprint or corporate permissions for this article, please click on the relevant link below:

Academic Permissions

Please note: Selecting permissions does not provide access to the full text of the article, please see our help page How do I view content?

Obtain permissions instantly via Rightslink by clicking on the button below:

If you are unable to obtain permissions via Rightslink, please complete and submit this Permissions form. For more information, please visit our Permissions help page.