
Figures & data
Figure 1. The variation of creep cavitation coefficient with different stress and temperature.
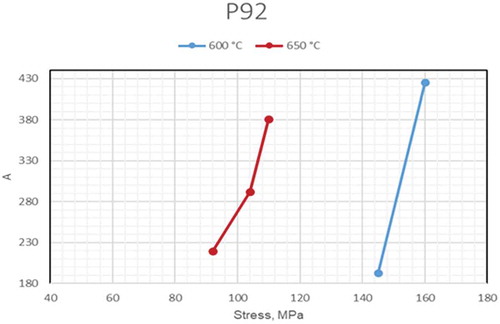
Table 1. The variation of creep cavitation coefficient A [Citation10].
Table 2. Materials and its parameters.
Figure 2. Experimental data of minimum strain rate and stress at 600°C and 650°C for P92 steel [Citation9,Citation11,Citation15].
![Figure 2. Experimental data of minimum strain rate and stress at 600°C and 650°C for P92 steel [Citation9,Citation11,Citation15].](/cms/asset/c15d44dc-bd4c-42cb-a876-3c8b18f87b6b/ymht_a_1716145_f0002_c.jpg)
Figure 3. The comparison between the different function of minimum creep strain rate and applied stress for P92 steel at 600°C.
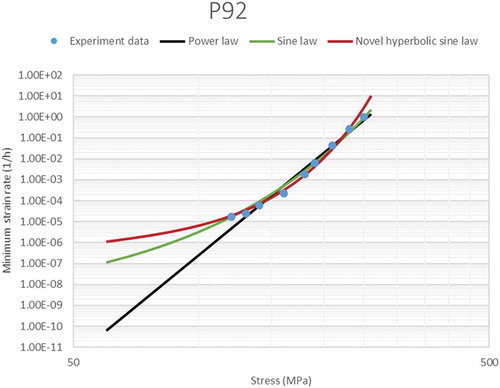
Table 3. The function of minimum creep strain rate with calibrated material parameters for P92 steel at 600°C.
Figure 4. The comparison between the different function of minimum creep strain rate and applied stress for P92 steel at 650°C.
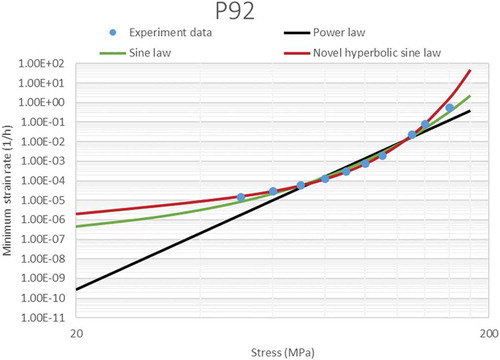
Table 4. The function of minimum creep strain rate with calibrated material parameters for P92 steel at 650°C.
Figure 5. No noticed difference of the predicted probability density function by Equation (3.1) (with α = 0.9999) and Equation (3.4) dots: experimental data from ref [Citation12,25] curves.
![Figure 5. No noticed difference of the predicted probability density function by Equation (3.1) (with α = 0.9999) and Equation (3.4) dots: experimental data from ref [Citation12,25] curves.](/cms/asset/51534a24-c496-46bc-9a8f-d218cce1961e/ymht_a_1716145_f0005_c.jpg)
Figure 6. The probability density function of cavity equivalent R for E911, dots: experimental data from ref [Citation12,25], curve by Equation (3.5.b).
![Figure 6. The probability density function of cavity equivalent R for E911, dots: experimental data from ref [Citation12,25], curve by Equation (3.5.b).](/cms/asset/0b5fbbd6-2641-4d19-877f-880c8927742f/ymht_a_1716145_f0006_c.jpg)
Table 5. Comparison of nucleation and growth rate coefficients.
Table 6. The value of U’ for P92 at 600°C [Citation24].
Table 7. The value of U’ for P92 at 625°C.
Table 8. The value of U’ for P92 at 650°C [Citation24].
Figure 7. The trend of the values of U’ under different stress and temperature [Citation24].
![Figure 7. The trend of the values of U’ under different stress and temperature [Citation24].](/cms/asset/dc6a9753-f182-473e-8e65-da08d9ac477e/ymht_a_1716145_f0007_c.jpg)
Figure 8. The trend of the values of U’ under different stress and temperature.
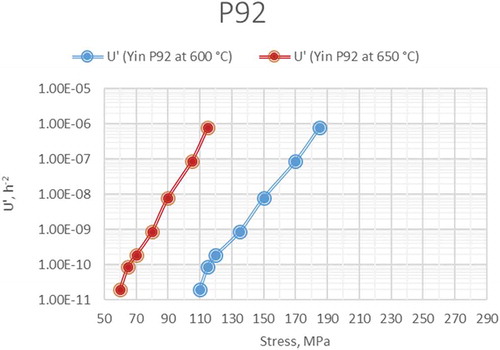
Table 9. The value of U’ for P92 at 600°C.
Table 10. The value of U’ for P92 at 650°C.
Figure 9. Comparison of Yin’s U’ with experiment [Citation11] for P92 steel [Citation24].
![Figure 9. Comparison of Yin’s U’ with experiment [Citation11] for P92 steel [Citation24].](/cms/asset/66248ee0-5ff7-4741-a35e-d0cfa4801494/ymht_a_1716145_f0009_c.jpg)
Figure 10. The trend of cavity nucleation rate coefficient A2 and stress.
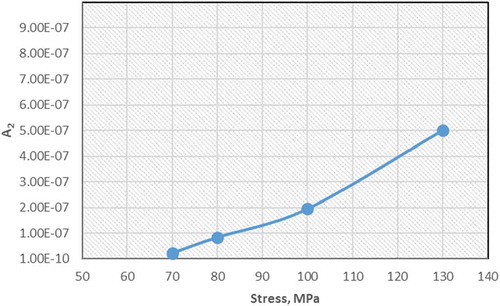
Table 11. The number of cavities at failure and the individual value of A2 under a range of stress levels.