
Figures & data
Table 1. The physicochemical properties of Solar Salt, Ref [Citation4].
Figure 1. LCA of 1 kg of binary Solar Salt. Tree diagram of the Climate Change impact category for a cut-off value of 18%.
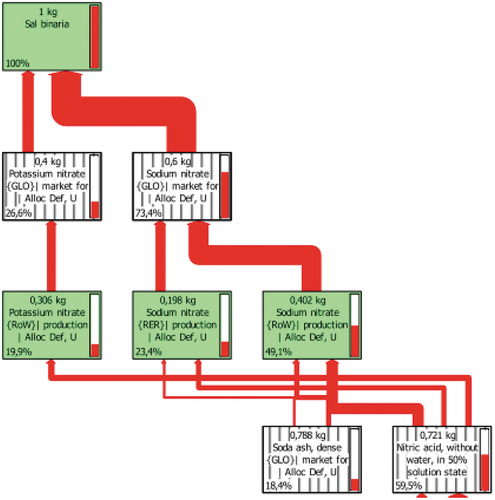
Table 2. Characterisation of 1 kg of each material.
Figure 2. Assessment of 1 kg ‘Binary salt’ 60%NaNO3-40%KNO3; Method: ReCiPe Midpoint (H) V1.09/Europe Recipe H/Characterisation.
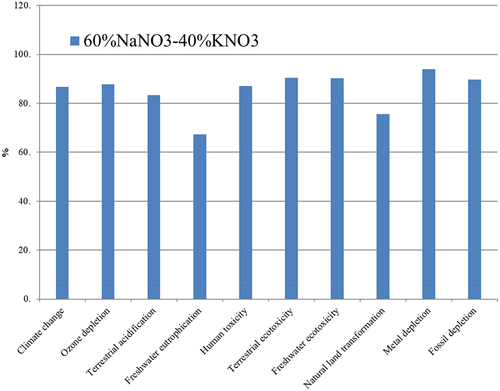
Figure 3. Standardisation of 1 kg of Solar Salt
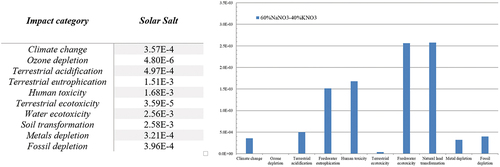
Table 3. 750 MWhth TES cost.
Table 4. The LCoE calculation of TES with 60% NaNO3–40% NaNO3 with the indirect collection.
Table 5. 60% NaNO3–40% KNO3 mass.
Table 6. The LCoE calculation of TES with 60%NaNO3–40% NaNO3 with direct uptake.