Figures & data
Table 1. Summary of the conditions used in the studies.
Table 2. Transformations described by Houghten and Yagloglou (Citation1923) to convert the answers given to three questions into a five-point scale.
Table 3. Overview of the judgement scales.
Table 4. Overview of scale usage in reviewed studies.
Table 5. Example questions for the three components of perception from pain research and corresponding examples for thermal comfort research.
Figure 1. Distribution of the operative temperatures for different votes. The violins show the shape of the distribution. The black dots show the mean values. The lines indicate the fit of a linear regression using a linear and a quadratic component. The grey-shaded areas around the curves indicate the 95% confidence interval of the values predicted by the linear model. Note that (for better visibility of the regression slopes) the scaling of the y-axis differs between the four plots.
Table 6. Results from the multiple regression analysis for the naturally ventilated (NV) buildings.
Table 7. Results from the multiple regression analysis for the conditioned (heating, ventilation and air-conditioning (HVAC)) buildings.
Figure 2. Density plots illustrating distribution of operative temperature for particular categories on the thermal sensation scale; a) for data from HVAC buildings, b) for data from NV buildings.
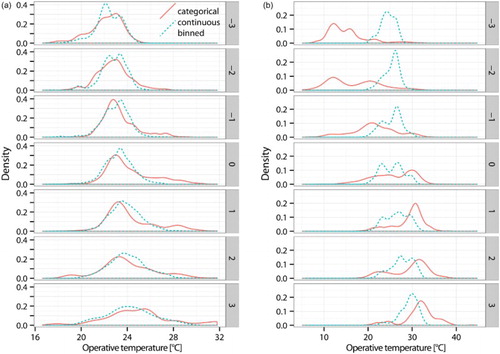
Figure 3. Boxplots of positions of TSV labels as drawn by subjects. Major ticks on the y-axis show positions of equal distances between labels. The line indicates the fit of a linear regression using a linear and a quadratic component. The grey shaded area around the line indicates 95% confidence interval.
Figure 4. Number of times that each vote within the comfortable range was mentioned.
Figure 5. Position of verbal labels of the thermal sensation vote as drawn by the subjects. From left to right the order is from cold to hot according to the 7-point ASHRAE scale. The area of comfort as described by each subjects is shown by black dots. Subjects without any black dot did not answer this question. Subjects stating an unequally spaced scale are subjects 1 to 17, subjects 18 to 30 stated an equally spaced scale, and subject 33 did not answer this question. Each line/point on the y axis represents one subject.