
Figures & data
Figure 1. Exterior view of case studies: (a) case C, (b) case F, (c) case H.
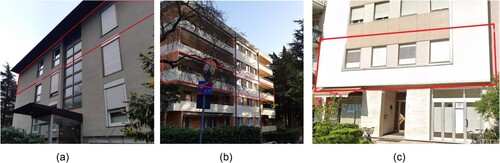
Table 1. Overview of case studies, thermal and physical characteristics (Data obtained from CasaClima certification documents & occupant survey).
Table 2. Measuring instruments specifications.
Table 3. Recorded outdoor air temperatures during the monitoring periods.
Table 4. Average indoor temperatures, and %RH.
Figure 2. Avg. indoor and outdoor temperatures, and (%RH) per apartment. (a) Case G with mechanical background ventilation, (b) case E with mechanical background ventilation. The solid red and black lines are more stable than in naturally ventilated apartments (see ).
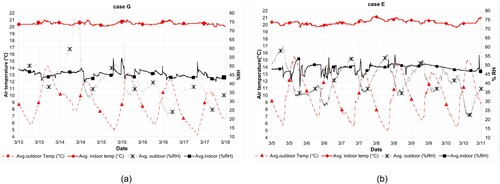
Figure 3. Avg. indoor and outdoor temperature, and (%RH) per apartment. (a) Case H un-retrofitted, (b) case C Naturally ventilated. The solid red and black lines fluctuate more compared to mechanically ventilated apartments (see ).
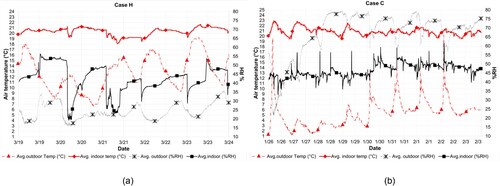
Figure 4. Average recorded indoor air temperature compared to the recommended values by CIBSE guide A and Italian Law.
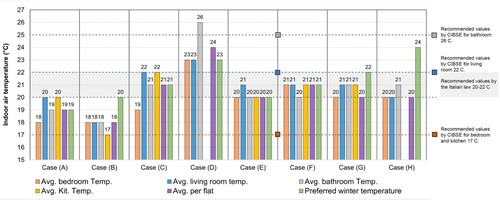
Figure 5. Average recorded indoor RH aligned with the recommended values by Sterling (40-60% RH).
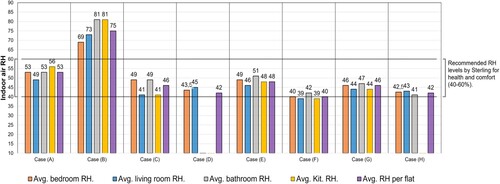
Table 5. Occupant satisfaction level, and temperature description on a 7 points scale for the indoor temperature during winter and summertime.
Figure 6. Comparison between AMV and PMV compared.
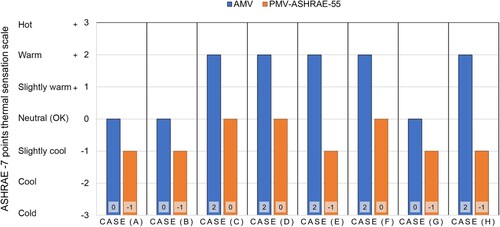
Figure 7. PMV modelled sensitivity analysis of different scenarios for each case study.
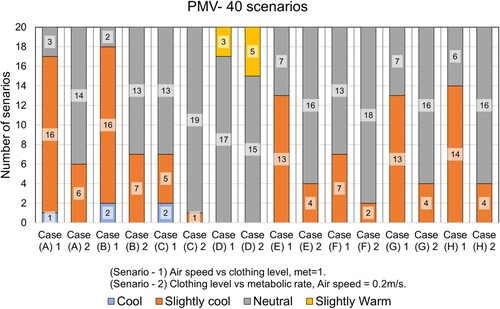
Figure 8. Air quality, natural lighting and DHW satisfaction level.
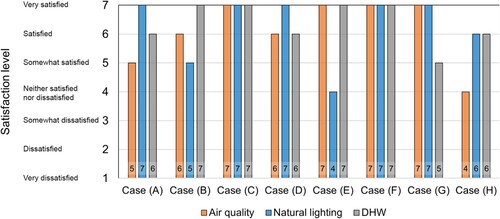
Figure 9. Some of the mould issues reported in (a) case B included mould on the bathroom ceiling, (b) case H on the wall facing the outside, and behind the radiator.
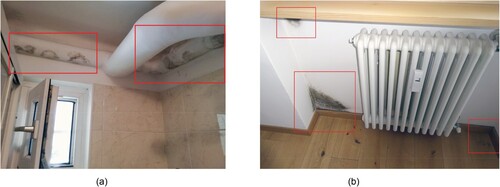
Table 6. Survey IEQ questions feedback.
Figure 10. Window opening habits as reported by occupants.
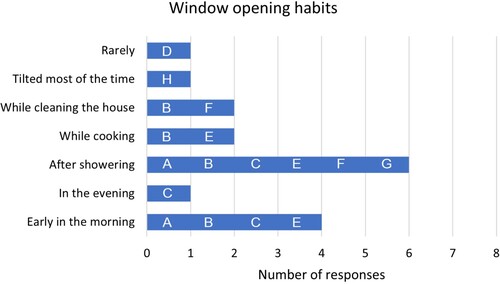
Table 7. Reported energy consumption of three cases.