Figures & data
Figure 1. SEM image of medial longitudinal section of quinoa seed. Perisperm (P), hypocotyl-radical axis (H), shoot appendix (SA), cotyledons (C), radicle (R), funicle (F) and pericarp (PE).
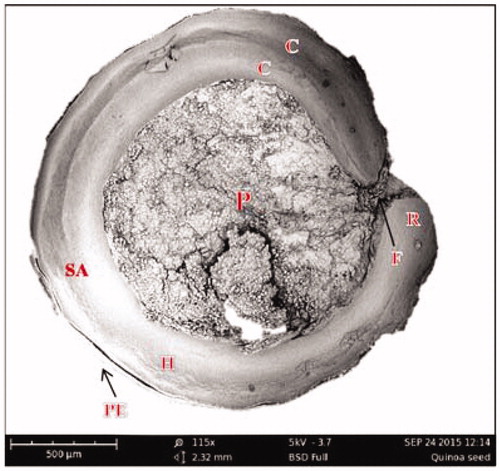
Figure 2. SEM images of quinoa fractions obtained by air jet sieve.
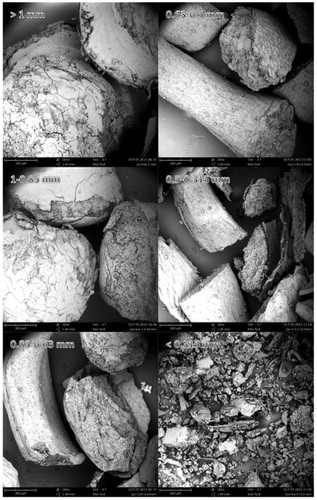
Table 1. Experimental characterisation of quinoa fractions after sieving.
Figure 3. Degree of hydrolysis (DH) of QPI obtained by the wet fractionation process unheated and pre-heated at 60, 90 and 120 °C.
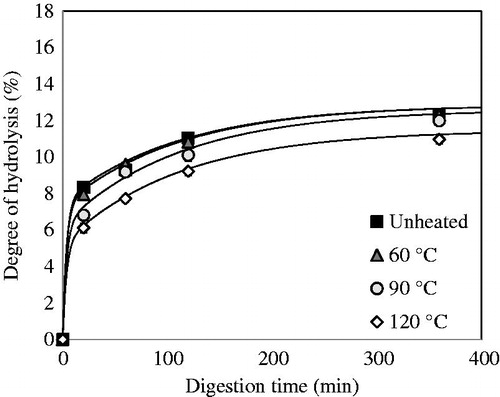
Figure 4. Light microscopy images of QPI solutions obtained by wet fractionation unheated and pre-heated at 60, 90 and 120 °C.
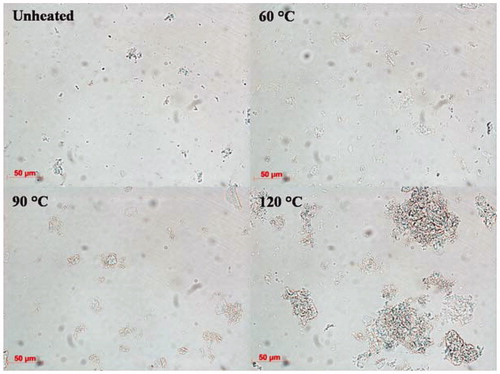
Figure 5. Particle size distribution of QPI unheated and pre-heated at 60, 90 and 120 °C and dissolved in Milli-Q water at pH2. Curves represent the average of three independent measurements.
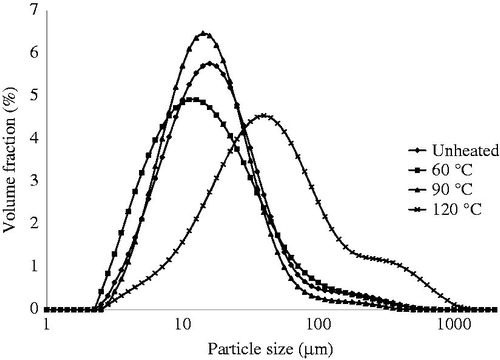
Figure 6. SEC-HPLC profiles of gastric digestion of QPI digested by pepsin for 6 h at 37 °C. (A) Unheated samples, (B) pre-heated at 60 °C, (C) pre-heated at 90 °C and (D) pre-heated at 120 °C.
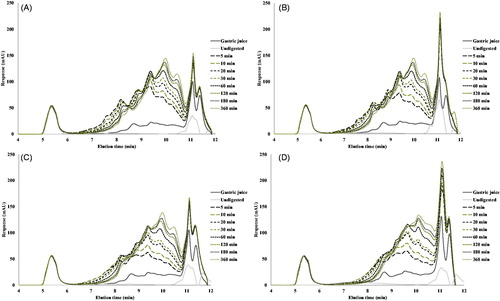
Figure 7. Degree of hydrolysis (DH) of quinoa protein obtained by the dry fractionation process unheated and pre-heated at 60, 90 and 120 °C.
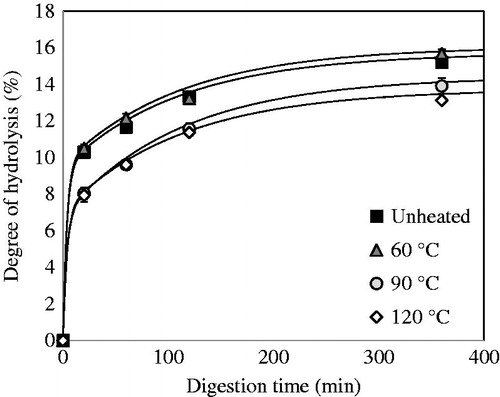
Figure 8. SEC-HPLC profiles of gastric digestion of DF fraction digested by pepsin for 6 h at 37 °C. (A) Unheated samples, (B) pre-heated at 60 °C, (C) pre-heated at 90 °C and (D) pre-heated at 120 °C.
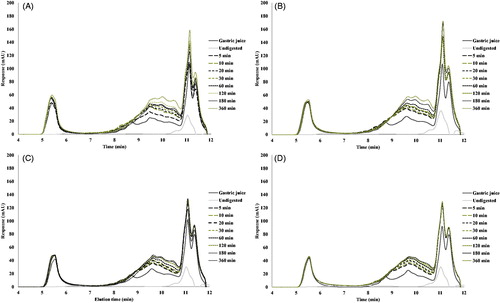
Figure 9. Digested fractions (left hand figure) and undigested fraction (right hand figure), as function of the pre-treatment temperature. The rate constants were assumed to be the same for QPI and QPC, and were fitted at k1=0.280 min−1 and k2=0.00895 min−1. (A) Wet fractionated QPI and (B) dry fractionated QPC.
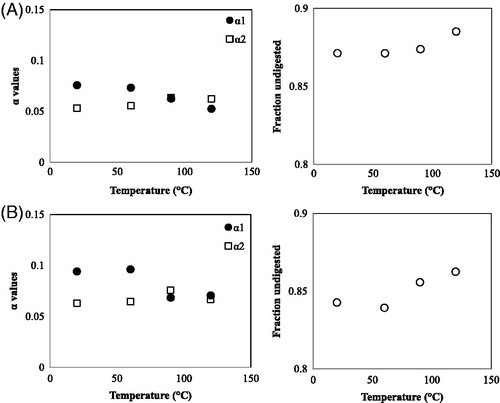
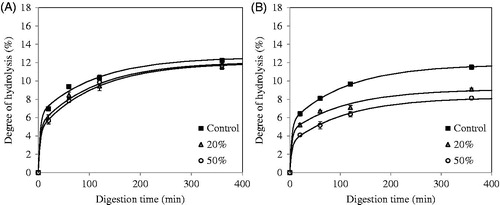
Figure 10. Degree of hydrolysis (DH) of the mixture of 5% of QPI and starch added different concentrations (0, 20 and 50% of starch) and pre-heated at (A) 90 °C and (B) 120 °C for 30 min.