Figures & data
Figure 1. Differences in food and macronutrient intakes (%) between the highest and lowest intake levels of sugar sweetened beverages (SSB), juice, tea, coffee and artificially sweetened beverages (ASB) (g/MJ). All differences above or below zero indicate significant associations (p for trend < 0.002) across five intake levels (three levels for ASB) in the total study population (n = 25,112).
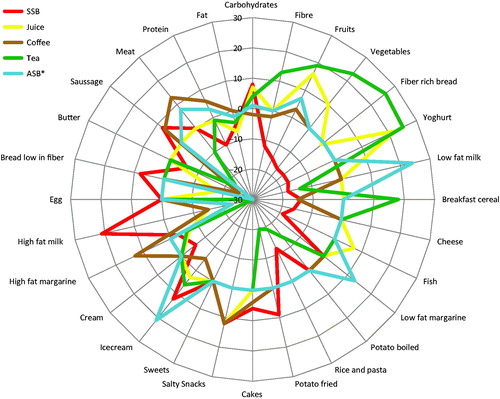
Table 1. Lifestyle characteristics according to five intake levels (g/MJ) of sugar sweetened beverages (SSB), juice, tea, coffee and three levels of artificially sweetened beverages (ASB) in the Malmö Diet and Cancer Study (n = 25,112).
Figure 2. Differences in food and macronutrient intakes (%) between the highest and lowest intake levels of sugar sweetened beverages (SSB), juice, tea and coffee (g/MJ). All differences above or below zero indicate significant associations (p for trend < 0.002) across five intake levels in all men (n = 9 800).
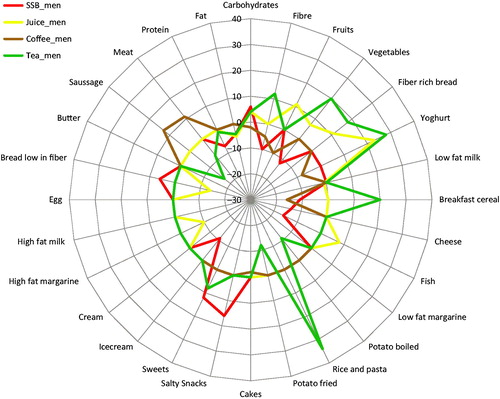
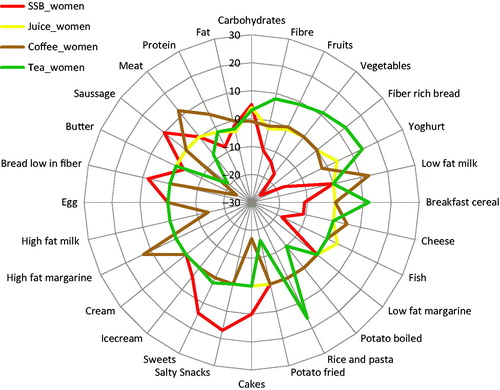
Figure 3. Differences in food and macronutrient intakes (%) between the highest and lowest intake levels of sugar sweetened beverages (SSB), juice, tea and coffee (g/MJ). All differences above or below zero indicate significant associations (p for trend <0.002) across five intake levels in all women (n = 15 312).