
Figures & data
Table 1. A list of foods given to the participants to choose gluten-free products in study two. (Source: Coeliac UK; www.coeliac.org.uk).
Table 2. Characteristics of participants who followed Gluten-containing diet (n = 11) and Gluten-free diet (n = 11) in study one.
Table 3. Participant characteristics (n = 11) before and after the Gluten-free diet intervention in study two.
Figure 1. Change in (a) blood glucose concentration (mean ± SEM) and (b) plasma insulin concentration (mean ± SEM) in the GFD and GCD group during OGTT. GFD: Gluten free diet; GCD: Gluten-containing diet; OGTT; oral glucose tolerance test.
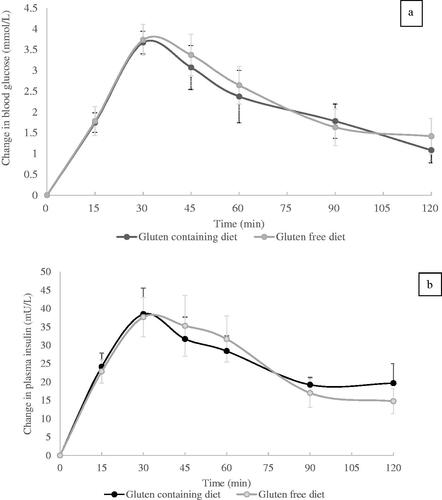
Figure 2. Change in (a) blood glucose concentration (mean ± SEM) and (b) plasma insulin concentration (mean ± SEM) during OGTT before and after the 4-week GFD intervention. Asterisk (*) denotes a significant difference (p<.05). OGTT: oral glucose tolerance test; GFD: Gluten free diet.
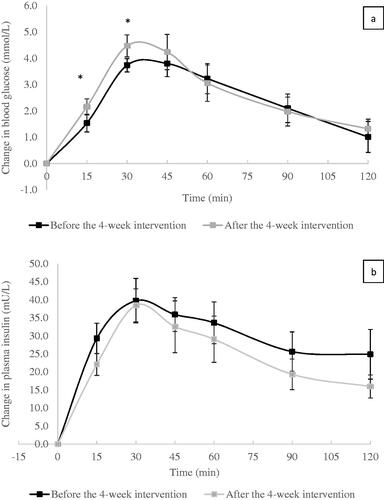
Table 4. The average daily energy and nutrient intake for participants in the gluten-containing diet group and gluten-free diet group (study one).
Table 5. Nutritional intake before and after the 4-week Gluten-free diet intervention (study two).
Data availability statement
Data available on request from the authors. The data that support the findings of this study are available from the corresponding author [PST], upon reasonable request.