
Figures & data
Figure 1. Percentage change in mineral nutrient content of fruits and vegetables between 1940 and 2019. **Significant change (p < 0.01); *significant change (p < 0.05).
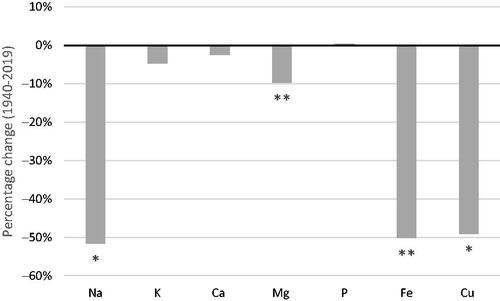
Table 1. Comparisons of minerals, water, and dry matter content of fruits and vegetables between 1940–1991, 1991–2019 and 1940–2019.
Table 2. Summary of changes over time in mineral content of horticultural produce reported in the literature (does not include reviews but only includes studies which performed analysis on national data sets).
Table 3. Lower Reference Nutrient Intake (LRNI) values in the UK.
Table 4. Percentage of UK NDNS participants with average daily intakes below the LRNI for mineral nutrients from food sources.
Supplemental material