
Figures & data
Figure 1. Flowchart of study progression.
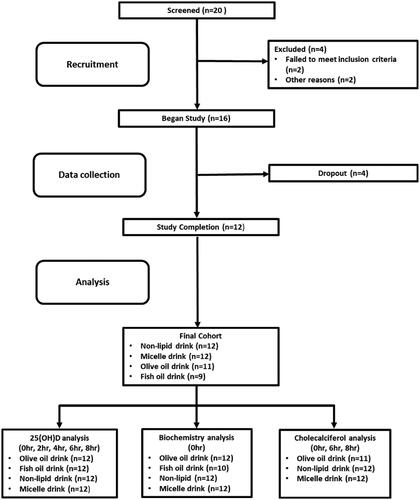
Table 1. Nutritional composition of the dairy drinks and study meals.
Table 2. Baseline subject characteristics, including anthropometric measurements, serum profile and dietary intake.
Figure 2. Postprandial 25(OH)D response to the study drinks in vitamin D sufficient participants and insufficient participants. Values are mean ± SE.
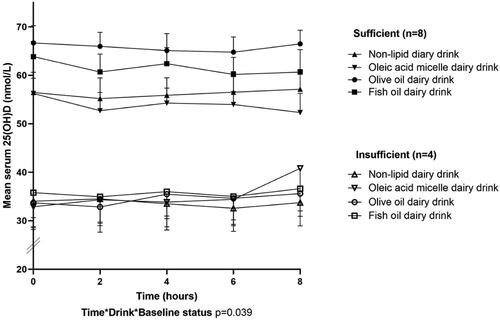
Table 3. Postprandial change in 25(OH)D concentrations in response to study drinks in vitamin D sufficient and insufficient participants.
Table 4. Baseline and postprandial serum cholecalciferol concentrations.