
Figures & data
Table 1. Nutraceutical formulation.
Figure 1. Effect of the whole formulation AminoDefence, quercetin and E. purpurea extract on NO release by macrophages. RAW264.7 cells were incubated for 48 h with the indicated increasing concentrations of the formulation AminoDefence (A), quercetin (B) or E. purpurea extract (C). NO release in the culture media was quantified through Griess test assay. Experiments were performed in triplicate and data are expressed as mean ± SD. Statistical analyses were performed using the one-way ANOVA coupled with Dunnett’s multiple comparison test. A value of p < 0.05 was considered statistically significant. **p < 0.01 vs basal.
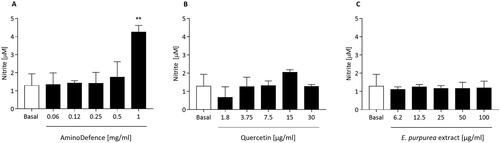
Figure 2. Effect of AminoDefence, quercetin and E. purpurea extract on IL-6 release by macrophages. RAW264.7 cells were incubated for 48 h with the indicated increasing concentrations of the formulation AminoDefence (A), quercetin (B) or E. purpurea extract (C). IL-6 release was determined through immunoenzymatic assay (ELISA). Experiments were performed in triplicate and data are expressed as mean ± SD. Statistical analyses were performed using the one-way ANOVA coupled with Dunnett’s multiple comparison test. A value of p < 0.05 was considered statistically significant. **p < 0.01; ***p < 0.001; ****p < 0.0001 vs basal.
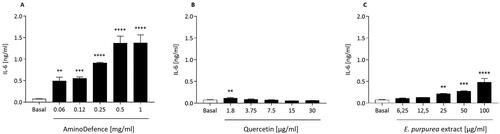
Figure 3. Effect of AminoDefence, quercetin and E. purpurea extract on TNF-α release by macrophages. RAW264.7 cells were incubated for 48 h with increasing concentrations of the formulation AminoDefence (A), quercetin (B) or E. purpurea extract (C). TNF-α release was determined through immunoenzymatic assay (ELISA). Experiments were performed in triplicate and data are expressed as mean ± SD. Statistical analyses were performed using the one-way ANOVA coupled with Dunnett’s multiple comparison test. A value of p < 0.05 was considered statistically significant. *p < 0.05; ***p < 0.001; ****p < 0.0001 vs basal.
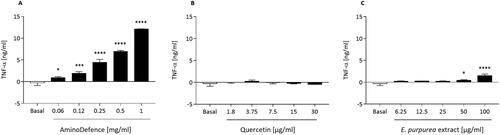
Figure 4. Effect of the whole formulation AminoDefence, quercetin and E. purpurea extract on MCP-1 release by macrophages. RAW264.7 cells were incubated for 48 h with the indicated increasing concentrations of the formulation AminoDefence (A), quercetin (B) or E. purpurea extract (C). MCP-1 release was determined through immunoenzymatic assay (ELISA). Experiments were performed in triplicate and data are expressed as mean ± SD. Statistical analyses were performed using the one-way ANOVA coupled with Dunnett’s multiple comparison test. A value of p < 0.05 was considered statistically significant. *p < 0.05; **p < 0.01; ****p < 0.0001 vs basal.
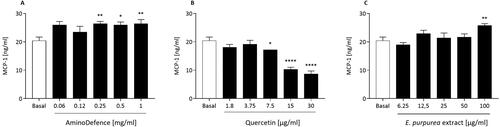
Figure 5. Effect of AminoDefence, quercetin and E. purpurea extract on NO release by LPS-stimulated macrophages. RAW264.7 cells were incubated for 24 h at 37 °C with Lipopolysaccharides (LPS) [1 µg/ml] and the indicated increasing concentrations of the formulation AminoDefence (A), quercetin (B) or E. purpurea extract (C). NO release in the culture media was quantified through Griess test assay. Experiments were performed in triplicate and data are expressed as mean ± SD. Statistical analyses were performed using the one-way ANOVA coupled with Dunnett’s multiple comparison test. A value of p < 0.05 was considered statistically significant. ****p < 0.0001 vs LPS-treated macrophages; °°°°p < 0.0001 vs macrophages in basal conditions.
![Figure 5. Effect of AminoDefence, quercetin and E. purpurea extract on NO release by LPS-stimulated macrophages. RAW264.7 cells were incubated for 24 h at 37 °C with Lipopolysaccharides (LPS) [1 µg/ml] and the indicated increasing concentrations of the formulation AminoDefence (A), quercetin (B) or E. purpurea extract (C). NO release in the culture media was quantified through Griess test assay. Experiments were performed in triplicate and data are expressed as mean ± SD. Statistical analyses were performed using the one-way ANOVA coupled with Dunnett’s multiple comparison test. A value of p < 0.05 was considered statistically significant. ****p < 0.0001 vs LPS-treated macrophages; °°°°p < 0.0001 vs macrophages in basal conditions.](/cms/asset/95b7a8f3-f965-47ed-937e-e1a3db4a603d/iijf_a_2283688_f0005_b.jpg)
Figure 6. Effect of the whole formulation AminoDefence, quercetin and E. purpurea extract on IL-6 release by LPS-stimulated macrophages. RAW264.7 cells were incubated for 24 h at 37 °C with Lipopolysaccharides (LPS) [1 µg/ml] and the indicated increasing concentrations of AminoDefence (A), quercetin (B) or E. purpurea extract (C). IL-6 release in the culture media was quantified through immunoenzymatic assay (ELISA). Experiments were performed in triplicate and data are expressed as mean ± SD. Statistical analyses were performed using the one-way ANOVA coupled with Dunnett’s multiple comparison test. A value of p < 0.05 was considered statistically significant. **p < 0.01; ***p < 0.001; ****p < 0.0001 vs LPS-treated macrophages; °°°°p < 0.0001 vs macrophages in basal conditions.
![Figure 6. Effect of the whole formulation AminoDefence, quercetin and E. purpurea extract on IL-6 release by LPS-stimulated macrophages. RAW264.7 cells were incubated for 24 h at 37 °C with Lipopolysaccharides (LPS) [1 µg/ml] and the indicated increasing concentrations of AminoDefence (A), quercetin (B) or E. purpurea extract (C). IL-6 release in the culture media was quantified through immunoenzymatic assay (ELISA). Experiments were performed in triplicate and data are expressed as mean ± SD. Statistical analyses were performed using the one-way ANOVA coupled with Dunnett’s multiple comparison test. A value of p < 0.05 was considered statistically significant. **p < 0.01; ***p < 0.001; ****p < 0.0001 vs LPS-treated macrophages; °°°°p < 0.0001 vs macrophages in basal conditions.](/cms/asset/5a6a986f-0cee-47e5-bf95-7da0898a6fce/iijf_a_2283688_f0006_b.jpg)
Figure 7. Effect of the whole formulation AminoDefence, quercetin, and E. purpurea extract on TNF-α release by LPS-stimulated macrophages. RAW264.7 cells were incubated for 24 h at 37 °C with Lipopolysaccharides (LPS) [1 µg/ml] and increasing concentrations of the formulation AminoDefence (A), quercetin (B) or E. purpurea extract (C). TNF-α release in the culture media was quantified through immunoenzymatic assay (ELISA). Experiments were performed in triplicate and data are expressed as mean ± SD. Statistical analyses were performed using the one-way ANOVA coupled with Dunnett’s multiple comparison test. A value of p < 0.05 was considered statistically significant. *p < 0.05; **p < 0.01; ***p < 0.001; ****p < 0.0001 vs LPS-treated macrophages; °°°°p < 0.0001 vs macrophages in basal conditions.
![Figure 7. Effect of the whole formulation AminoDefence, quercetin, and E. purpurea extract on TNF-α release by LPS-stimulated macrophages. RAW264.7 cells were incubated for 24 h at 37 °C with Lipopolysaccharides (LPS) [1 µg/ml] and increasing concentrations of the formulation AminoDefence (A), quercetin (B) or E. purpurea extract (C). TNF-α release in the culture media was quantified through immunoenzymatic assay (ELISA). Experiments were performed in triplicate and data are expressed as mean ± SD. Statistical analyses were performed using the one-way ANOVA coupled with Dunnett’s multiple comparison test. A value of p < 0.05 was considered statistically significant. *p < 0.05; **p < 0.01; ***p < 0.001; ****p < 0.0001 vs LPS-treated macrophages; °°°°p < 0.0001 vs macrophages in basal conditions.](/cms/asset/baa0712a-d628-4378-b2b0-8c9b8c2cb009/iijf_a_2283688_f0007_b.jpg)
Figure 8. Effect of the whole formulation AminoDefence, quercetin, and E. purpurea extract on MCP-1 release by LPS-stimulated macrophages. RAW264.7 cells were incubated for 24 h at 37 °C with Lipopolysaccharides (LPS) [1 µg/ml] and increasing concentrations of the formulation AminoDefence (A), quercetin (B) or E. purpurea extract (C). MCP-1 release in the culture media was quantified through immunoenzymatic assay (ELISA). Experiments were performed in triplicate and data are expressed as mean ± SD. Statistical analyses were performed using the one-way ANOVA coupled with Dunnett’s multiple comparison test. A value of p < 0.05 was considered statistically significant. *p < 0.05; **p < 0.01; ***p < 0.001; ****p < 0.0001 vs LPS-treated macrophages; °°°°p < 0.0001 vs macrophages in basal conditions.
![Figure 8. Effect of the whole formulation AminoDefence, quercetin, and E. purpurea extract on MCP-1 release by LPS-stimulated macrophages. RAW264.7 cells were incubated for 24 h at 37 °C with Lipopolysaccharides (LPS) [1 µg/ml] and increasing concentrations of the formulation AminoDefence (A), quercetin (B) or E. purpurea extract (C). MCP-1 release in the culture media was quantified through immunoenzymatic assay (ELISA). Experiments were performed in triplicate and data are expressed as mean ± SD. Statistical analyses were performed using the one-way ANOVA coupled with Dunnett’s multiple comparison test. A value of p < 0.05 was considered statistically significant. *p < 0.05; **p < 0.01; ***p < 0.001; ****p < 0.0001 vs LPS-treated macrophages; °°°°p < 0.0001 vs macrophages in basal conditions.](/cms/asset/00f34975-6cc5-4a2d-9a19-11b7f5a46446/iijf_a_2283688_f0008_b.jpg)
Figure 9. Effect of AminoDefence, quercetin and E. purpurea extract on NO release by Polyinosinic:polycytidylic acid (PolyI:C)-stimulated macrophages. RAW264.7 cells were incubated for 24 h at 37 °C with Polyinosinic:polycytidylic acid (PolyI:C) [50 µg/ml] and the indicated increasing concentrations of the formulation AminoDefence (A), quercetin (B) or E. purpurea extract (C). NO release in the culture media was quantified through Griess test assay. Experiments were performed in triplicate and data are expressed as mean ± SD. Statistical analyses were performed using the one-way ANOVA coupled with Dunnett’s multiple comparison test. A value of p < 0.05 was considered statistically significant. ***p < 0.001; ****p < 0.0001 vs PolyI:C-treated macrophages. °°°°p < 0.0001 vs macrophages in basal conditions.
![Figure 9. Effect of AminoDefence, quercetin and E. purpurea extract on NO release by Polyinosinic:polycytidylic acid (PolyI:C)-stimulated macrophages. RAW264.7 cells were incubated for 24 h at 37 °C with Polyinosinic:polycytidylic acid (PolyI:C) [50 µg/ml] and the indicated increasing concentrations of the formulation AminoDefence (A), quercetin (B) or E. purpurea extract (C). NO release in the culture media was quantified through Griess test assay. Experiments were performed in triplicate and data are expressed as mean ± SD. Statistical analyses were performed using the one-way ANOVA coupled with Dunnett’s multiple comparison test. A value of p < 0.05 was considered statistically significant. ***p < 0.001; ****p < 0.0001 vs PolyI:C-treated macrophages. °°°°p < 0.0001 vs macrophages in basal conditions.](/cms/asset/018a4ed3-ef05-455e-91da-55317d050522/iijf_a_2283688_f0009_b.jpg)