Figures & data
Table 1. Instruments and domains of the variables collected in this study.
Figure 1. Study flowchart.
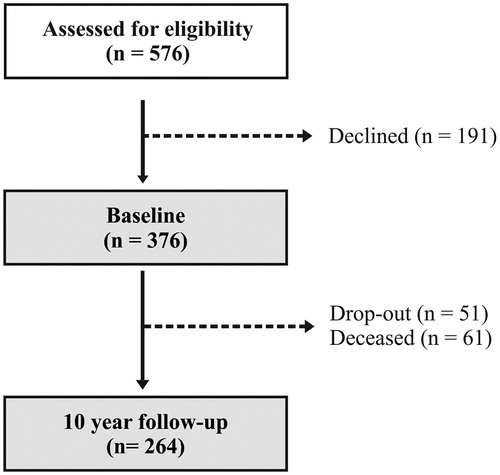
Table 2. Baseline data for participants with mild, moderate and severe MS completing the study and those lost to the 10-year follow-up.
Figure 2. Percentages of people in the (A) mild, (B) moderate and (C) severe MS groups demonstrating dependency in personal and instrumental activities of daily living at baseline and the 10-year follow-up. Each activity was scored as being “dependent” (i.e. requiring assistance) or “independent” (i.e. able to perform the activity without assistance) according to the Katz ADL Index Extended. Data presents the percentages of people with MS who reported dependency. *Significant difference (p ≤ 0.01) between baseline and the 10-year follow-up.
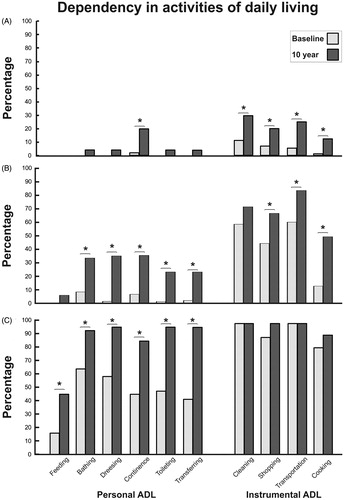
Table 3. Proportions (percentages) in the mild, moderate and severe MS group demonstrating activity limitations (i.e. dependency in ADL) and participation restrictions (i.e. restrictions in social/lifestyle activities) at baseline and 10-year follow-up.
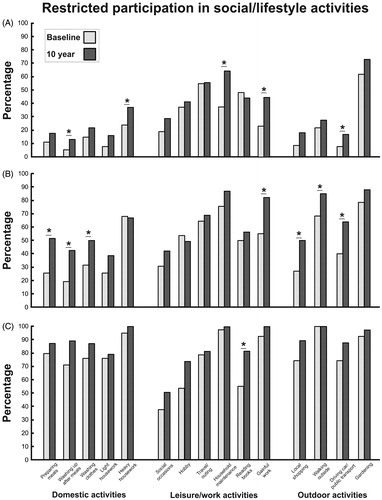
Figure 3. Percentages of people in the (A) mild, (B) moderate and (C) severe MS groups demonstrating participation restrictions in domestic, leisure/work and outdoor activities at baseline and the 10-year follow-up. Each activity was scored between 0 and 3 (0 = “never” and 3 = “at least weekly”) according to the Frenchay Activities Index and people with MS who reported 0 or 1 were classified as being restricted in that activity. Data presents the percentages of people with MS who reported restricted participation. *Significant difference (p ≤ 0.01) between baseline and the 10-year follow-up.