
Figures & data
Table 1. Participant characteristics per focus group session (N = 21).
Table 2. Characteristics of participating workers (N = 21).
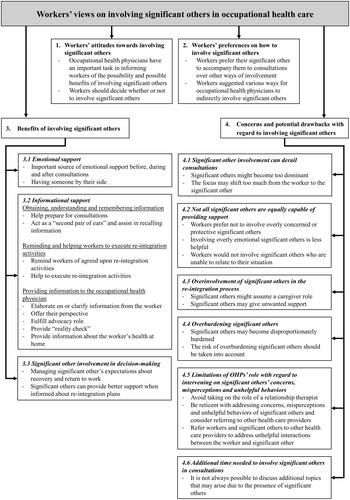
Figure 1. Overview of themes and subthemes. .
Tree diagram depicting the four main themes “attitudes towards involving significant others”, “preferences on how to involve significant others”, “benefits of involving significant others”, and “concerns with regard to involving significant others” and their corresponding subthemes.
Data availability statement
The datasets generated and/or analyzed during the current study are not publicly available due to identifying information, but are available from the corresponding author upon reasonable request.