
Figures & data
Table 1. Electronic database search terms.
Figure 1. PRISMA diagram.
A flow chart is presented, presenting the PRISMA diagram. Five thousand nine hundred and ninety-seven studies are identified through the initial database search. One thousand three hundred and sixty two duplicates are removed. Four thousand six hundred and thirty five articles are screened at the title and abstract phase. Four thousand two hundred and twelve are excluded as they were found to be irrelevant. Four hundred and twenty three are screened at the full text stage. Three articles are found through a hand search. A final total of thirty-seven studies are included in the scoping review.
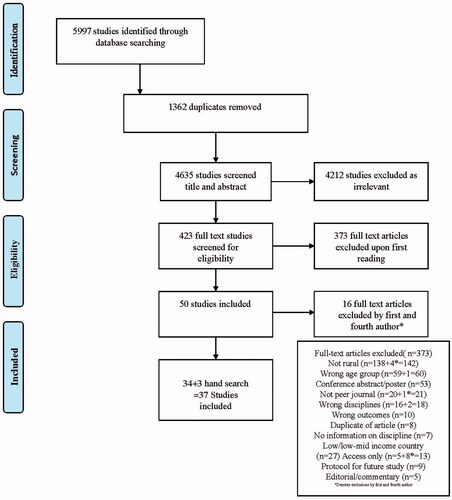
Table 2. Studies about services provided in-person.
Table 3. Studies of services offered via telepractice.