
Figures & data
Table 1. Participants.
Table 2. Scores on assessments.
Table 3. Group comparisons on quantitative aspects of word-finding difficulties.
Table 4. Group comparisons on qualitative aspects of word-finding difficulties.
Figure 1. Confrontation-naming accuracy (in per cent) for high-frequency nouns and verbs (OANB, top left) and low-frequency nouns (BNT, top right). OANB: Object and Action Naming Battery; BNT: Boston Naming Test; MSAS: Moderate to severe anomia in stroke; MAS: Mild anomia in stroke; PD: Parkinson’s disease; MS: Multiple sclerosis.
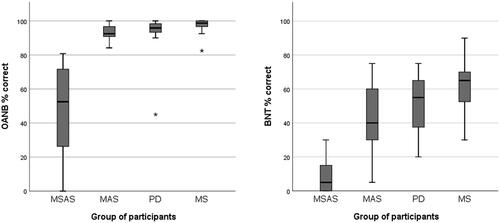
Figure 2. Scores on the oral verbal-fluency tasks. MSAS: Moderate to severe anomia in stroke; MAS: Mild anomia in stroke; PD: Parkinson’s disease; MS: Multiple sclerosis; COSEF: complex oral semantic verbal fluency.
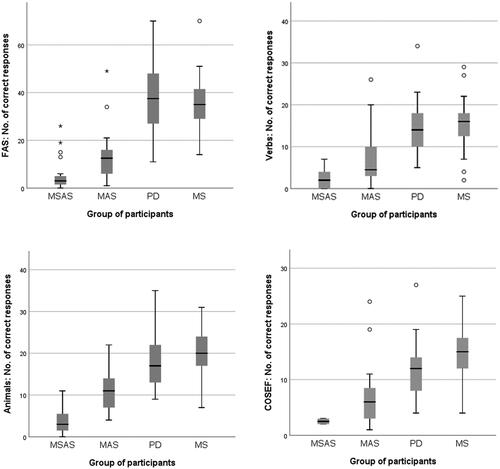
Figure 3. Total scores (percentages) on the re-telling task, based on main-concept analysis (MCA). MSAS: Moderate to severe anomia in stroke. MAS: Mild anomia in stroke; PD: Parkinson’s disease; MS: Multiple sclerosis.
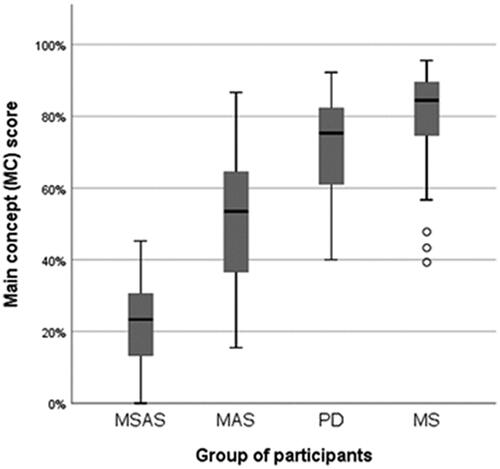
Figure 4. Self-perceived communicative participation as reported in the 10 –item short-form Communicative Participation Item Bank (CPIB), where interference with communicative participation were rated from 3 (“not at all”) to 0 (“very much”). MSAS: Moderate to severe anomia in stroke; MAS: Mild anomia in stroke; PD: Parkinson’s disease; MS: Multiple sclerosis.
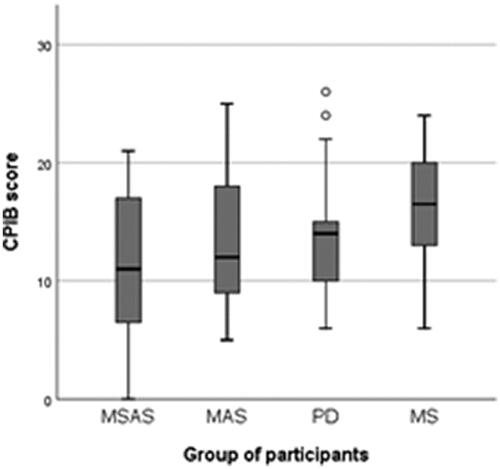
Figure 5. Response time (RT) in seconds per item in confrontation naming of high-frequency nouns and verbs (OANB) and low-frequency nouns (BNT). OANB: Object and Action Naming Battery (high-frequency items); BNT: Boston Naming Test (low-frequency items); MSAS: Moderate to severe anomia in stroke; MAS: Mild anomia in stroke; PD: Parkinson’s disease; MS: Multiple sclerosis.
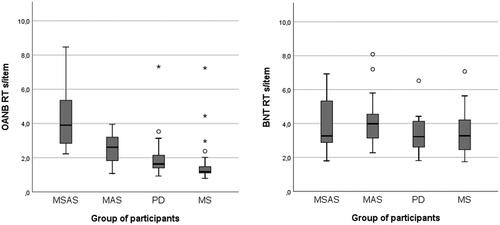
Figure 6. Categories of inadequate responses in confrontation naming, as proportions (top) and as mean numbers of cases (bottom). MSAS: Moderate to severe anomia in stroke. MAS: Mild anomia in stroke; PD: Parkinson’s disease; MS: Multiple sclerosis.
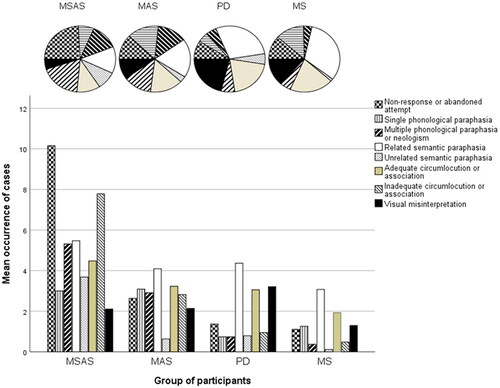
Figure 7. Percentages of correctly named nouns and verbs in OANB confrontation naming. MSAS: Moderate to severe anomia in stroke. MAS: Mild anomia in stroke; PD: Parkinson’s disease; MS: Multiple sclerosis.
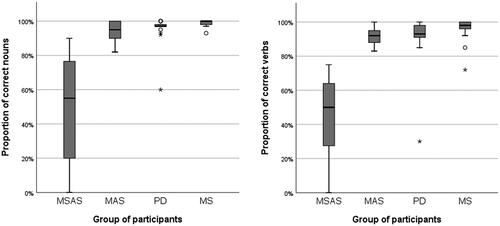
Figure 8. Results from the main-concept analysis (MCA) of the re-telling task: percentages of accurate and compete (AC), accurate but incomplete (AI), incorrect (IN) and absent (AB) main concepts. MSAS: Moderate to severe anomia in stroke. MAS: Mild anomia in stroke; PD: Parkinson’s disease; MS: Multiple sclerosis. The corresponding proportions in a reference group were 82.7% AC, 5.7% AI, 2.0% IN and 9.6% AB.
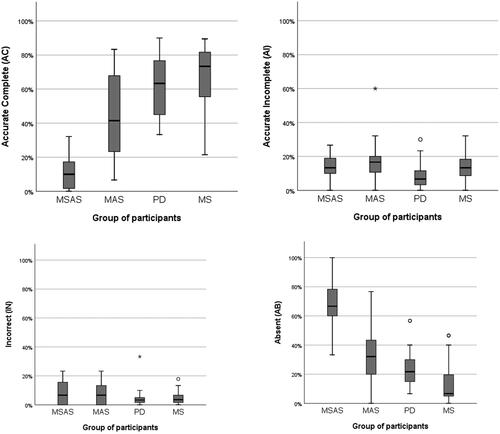
Table 5. Correlations between self-reports and formal assessments.
Table Appendix 1. Results when the PD participant with extreme value in the confrontation naming task was excluded.