Figures & data
Figure 1. This Figure describes the distribution of the target sample across study programmes. Accounting and Finance Degree and Marketing and Value Chain Management Degree represent the largest number of respondents. The number of responses is 236.
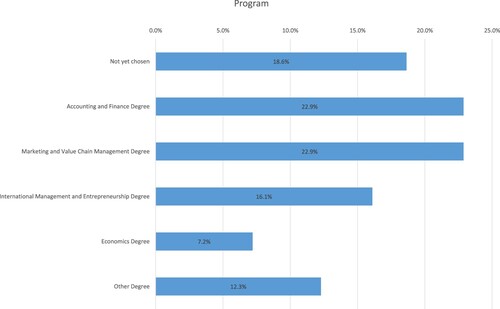
Figure 2. This Figure shows students’ answers on the question regarding their responsibility on assuring and self-regulating their learning during the pandemic. The number of responses is 236.
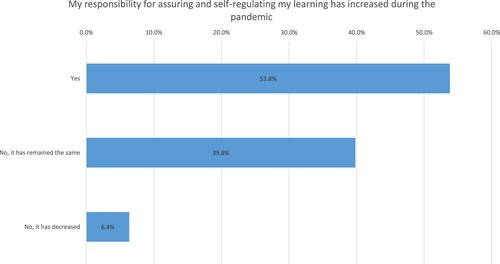
Figure 3. This Figure describes students’ responses on the usefulness of remote teaching in self-regulating their learning in the courses where the course work consists of assignments and/or a final exam. The blue bar in the chart represents a total of 231 responses from business students, whereas the green bar represents a total of 40 responses from accounting students.
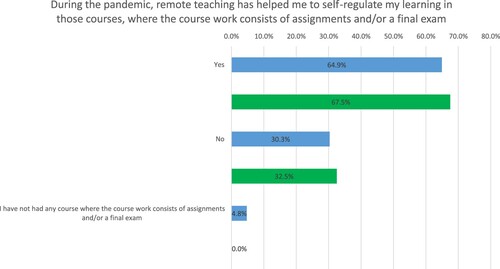
Figure 4. This Figure describes students’ responses with regard to their preferences for testing their learning. The blue bar in the chart represents a total of 235 responses from business students, whereas the green bar represents a total of 41 responses from accounting students.
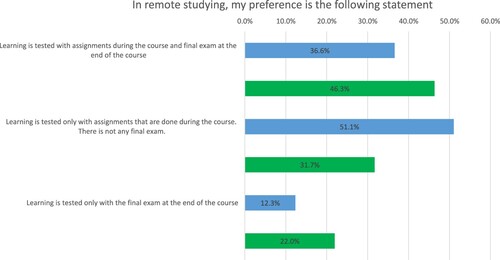
Figure 5. This Figure describes students’ responses with regard to teachers’ assessment methods during the pandemic. The blue bar in the chart represents a total of 231 responses from business students, whereas the green bar represents a total of 42 responses from accounting students.
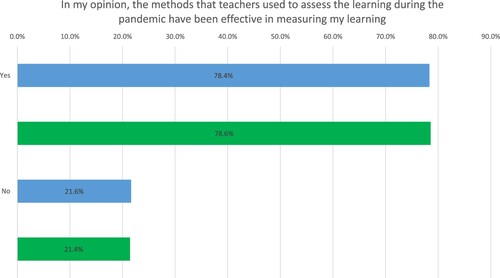
Figure 6. This Figure describes students’ opinions on the importance of electronic exams (unmonitored Moodle exams or supervised EXAM exams) for the assessment of their learning. The blue bar in the chart represents a total of 231 responses from business students, whereas the green bar represents a total of 42 responses from accounting students.
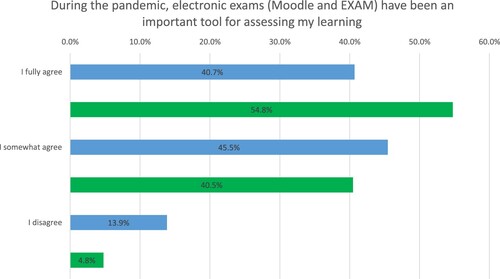
Figure 7. This Figure describes students’ opinions on the need for more effective identification strategies to better monitor students’ course work in remote teaching. The blue bar in the chart represents a total of 233 responses from business students, whereas the green bar represents a total of 41 responses from accounting students.
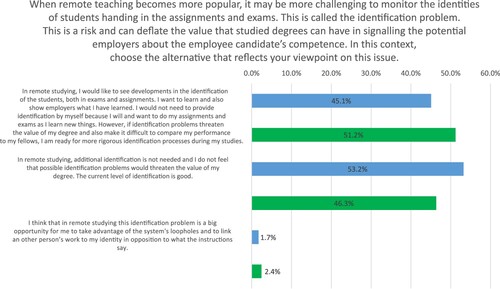
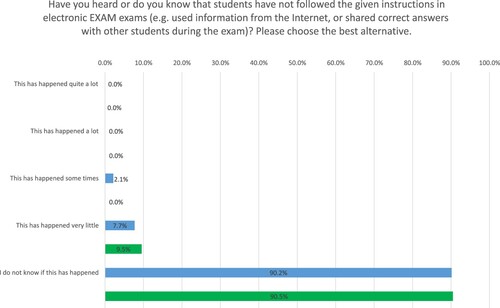
Figure 8. This Figure describes students’ answers to monitoring problems in electronic EXAM exams. The blue bar in the chart represents a total of 234 responses from business students, whereas the green bar represents a total of 42 responses from accounting students.