
Figures & data
Table 1. Surveyed demonstrations.
Figure 1. Age distribution.
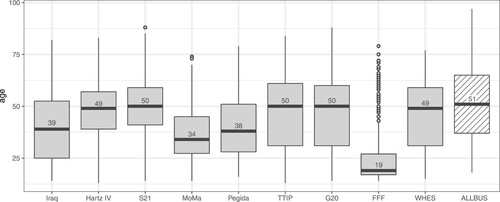
Figure 2. Gender distribution.
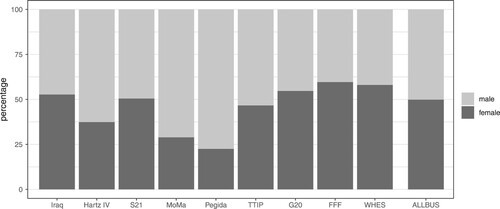
Figure 3. Self-placement on the left-right scale.
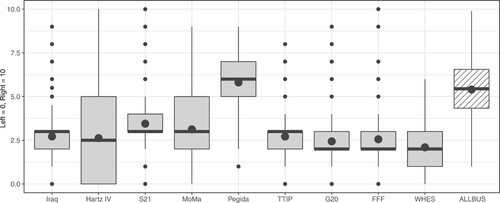
Table 2. Overview of two demonstration clusters.
Figure 4. Satisfaction with democracy in Germany.
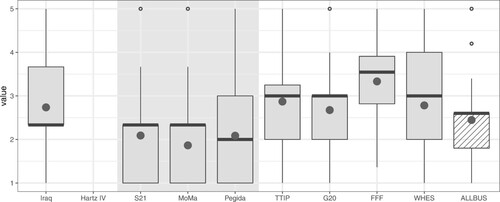
Figure 5. Trust in political institutions. Notes: The demonstration cluster of the ‘disenchanted critics’ is highlighted with a grey background. The levels of trust for the Pegida demonstrations and Peace Vigils are slightly overvalued as questionnaires at these demonstrations did not include the option ‘partly trust’ – in contrast to the other demonstrations.
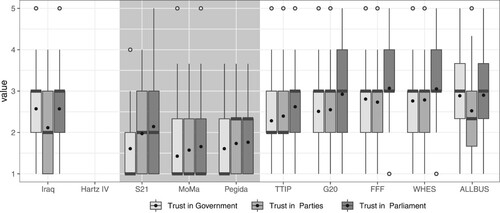
Figure 6. Perceived self-efficacy.
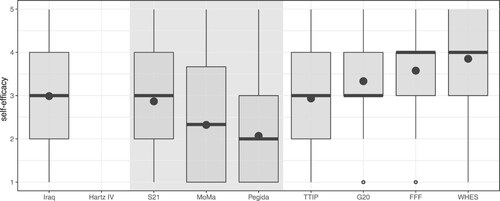
Table 3. Overview of linear regression models.
Table A1. Linear regression: dependent variable ‘satisfaction with democracy’ (1–5).
Table A2. Linear regression: dependent variable ‘trust in government’ (1–5).
Data Availability Statement
Survey data used for this paper is not generally available but replication data can be obtained by the authors upon request.