
Figures & data
Table 1. An overview of the PAR process and the study’s data.
Image 1. A participant’s ‘Blob tree’ at the evaluation in workshop 1 (Wilson and Long Citation2005).
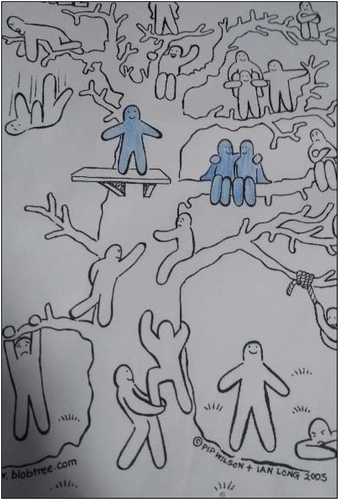
Table 2. The seven core ethical principles guiding the research process.