Figures & data
Figure 1. The logic of intervention in innovation strategies for smart specialization. Source: Gianelle and Kleibrink (Citation2015, p. 6).
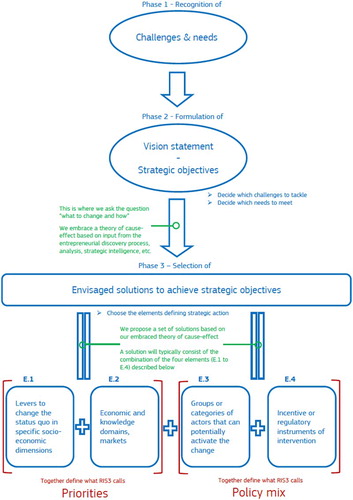
Figure 2. An illustration of the logic of intervention in agro-food. Source: Gianelle and Kleibrink (Citation2015, p. 7).
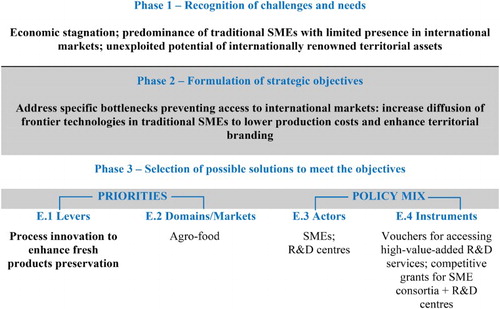
Table 1. Comparison of respondent sample with all NUTS 2 regions by GDP levels.
Figure 3. Perception of policy-makers on the main functions fulfilled by monitoring. Source: Own elaboration. Respondents were asked to state how much they think these monitoring functions are important for RIS3.
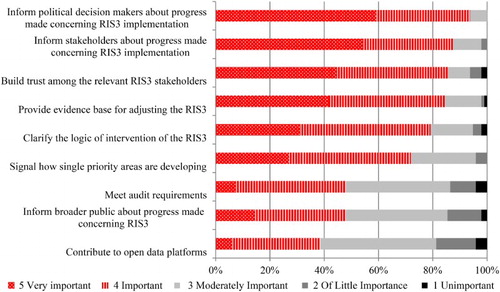
Figure 4. The dissemination channels of monitoring results according to national and regional policy-makers. Source: Own elaboration. Respondents were asked how RIS3 monitoring data will be disseminated. Multiple choices were allowed.
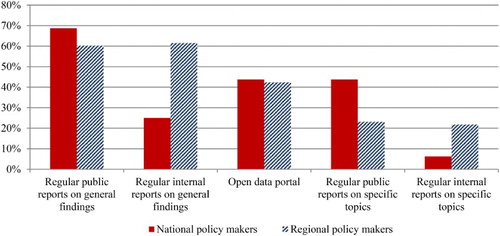
Figure 5. Perception of policy-makers on the association of expected changes and the RIS3. Source: Own elaboration. Respondents were asked which of these statements best describe how expected changes relate to the different elements of RIS3. Multiple choices were allowed.
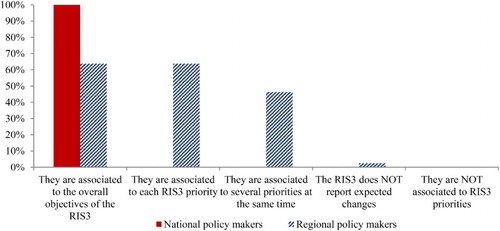
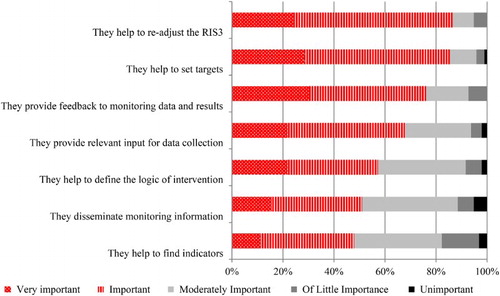
Figure 6. Perception of policy-makers about the role of result indicators in their RIS3 monitoring. Source: Own elaboration. Respondents were asked which of these statements best describe how result indicators relate to the different elements of the RIS3. Multiple choices were allowed.
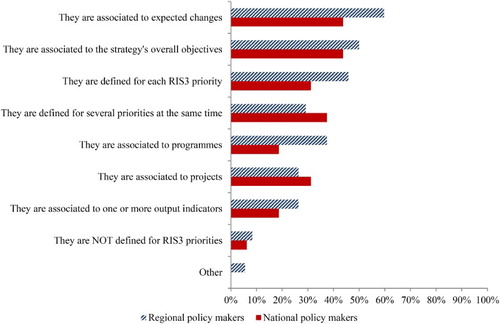
Figure 7. The main sources of information and methodologies employed to monitor the RIS3 according to national and regional policy-makers. Source: Own elaboration. Respondents were asked to choose among sources of data and methodologies used for the monitoring of their respective RIS3.
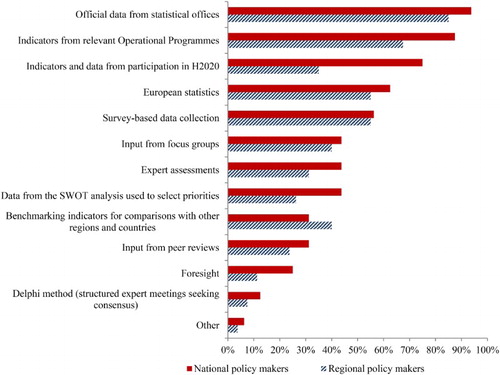
Figure 8. The role of stakeholders in the monitoring of the RIS3 according to national and regional policy-makers. Source: Own elaboration. Respondents were asked to grade the potential role of stakeholders in the RIS3 monitoring (from unimportant to very important).