Figures & data
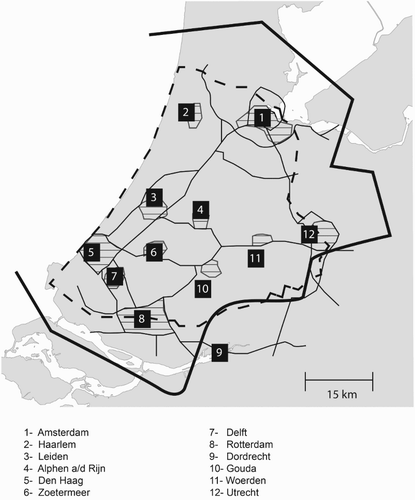
Figure 1. Randstad Holland.
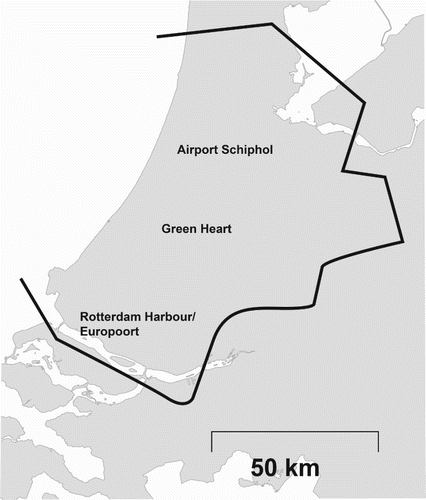
Table 1. Growth of population, Amsterdam, Rotterdam, The Hague, Utrecht, 2000–2016.
Table 2. Aspects of spatial development of the Randstad before and after 1990.
Figure 2. VINEX development areas in the Randstad Holland. Source: Kruythoff and Teule (Citation1997, p. 115).
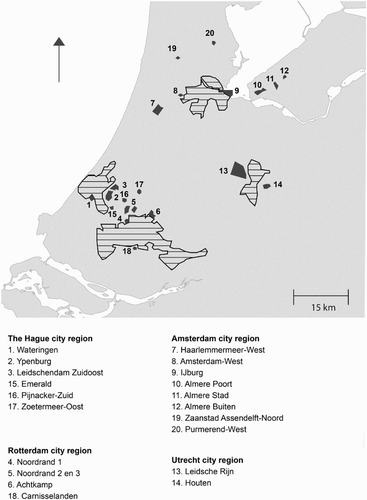
Figure 3. Five tunnels, proposed by the Ministry of Transport (1988). Source: Priemus and Visser (Citation1995).
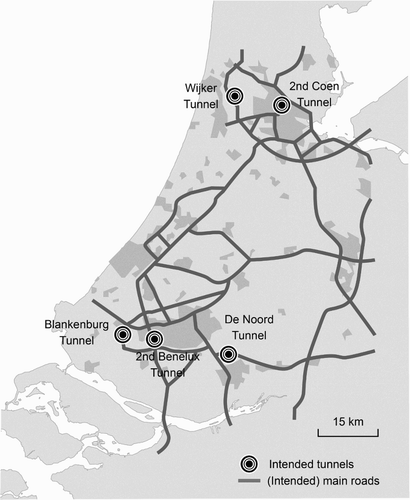
Figure 4. Dyke Ring 14: Central Holland. Source: Priemus (Citation2010).
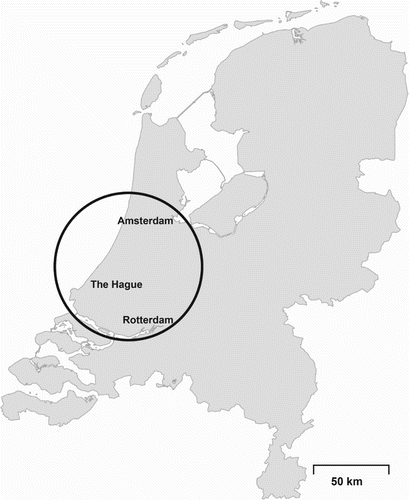
Figure 5. Randstad Holland: compartmentalization with elevated infrastructures around and between cities. Source: Priemus (Citation2010).