
Figures & data
Figure 1. Population density in the Euroregion, 2001 (A), e 2014 (B). Source: CAOP 2015; Diva GIS; Statistics Portugal (INE) and Galician Statistical Office (IGE), 2001, 2011 e 2014 (Own elaboration).
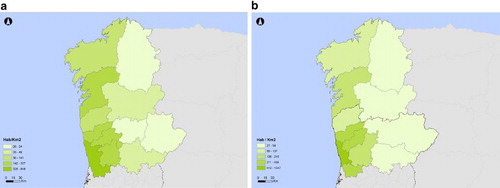
Figure 1. Population density in the Euroregion, 2001 (A), e 2014 (B). Source: CAOP 2015; Diva GIS; Statistics Portugal (INE) and Galician Statistical Office (IGE), 2001, 2011 e 2014 (Own elaboration).
Please note: Selecting permissions does not provide access to the full text of the article, please see our help page How do I view content?
To request a reprint or corporate permissions for this article, please click on the relevant link below:
Please note: Selecting permissions does not provide access to the full text of the article, please see our help page How do I view content?
Obtain permissions instantly via Rightslink by clicking on the button below:
If you are unable to obtain permissions via Rightslink, please complete and submit this Permissions form. For more information, please visit our Permissions help page.