Figures & data
Table 1. Land use: built-up areas in Austria: descriptive overview.
Table 2. Changes in existing frameworks targeting built-up areas.
Figure 1. Total land consumption in Austria, and annual increase of land consumption (1995-2016). See for a description of the variables. Source: Own draft and calculations based on UBA (Citation2017) and STAT (Citation2017).
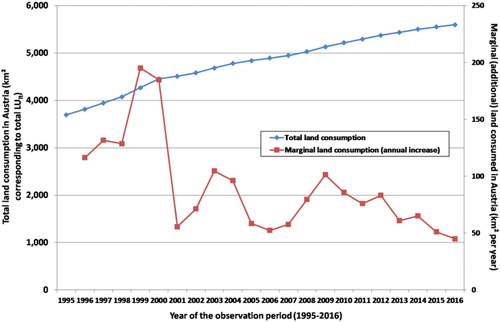
Figure 2. Total land consumption population and GDP growth in Austria (1995–2016; index 1995 = 100). See for a description of the variables. Source: Own draft and calculations based on UBA (Citation2017) and STAT (Citation2017).
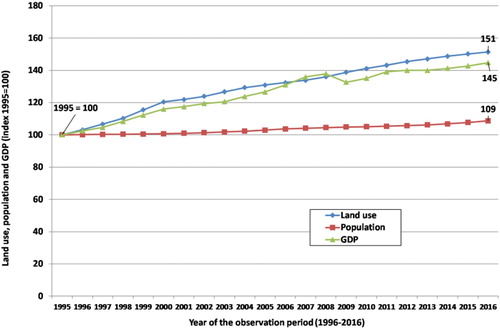
Figure 3. Additional (increase) of land consumption per-capita (hectares per year). See for a description of the variables. Source: Own draft and calculations based on UBA (Citation2017) and STAT (Citation2017).
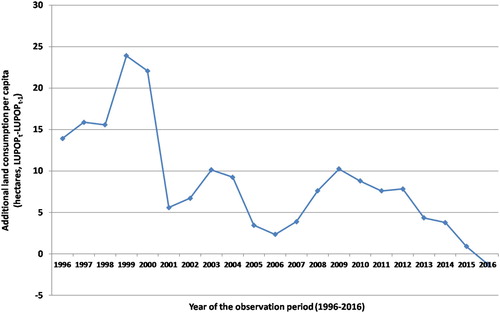
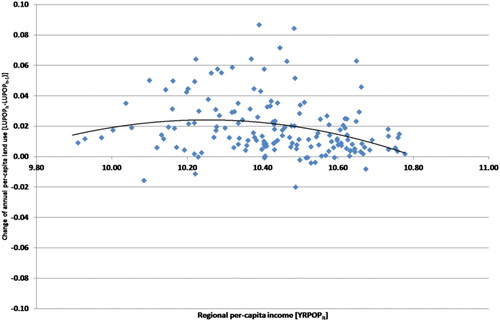
Figure 4. The changes in per-capita land consumption, and regional per-capita GDP (with all nine Federal Provinces including Vienna). See for a description of the variables. Source: Own draft and calculations based on UBA (Citation2017) and STAT (Citation2017).
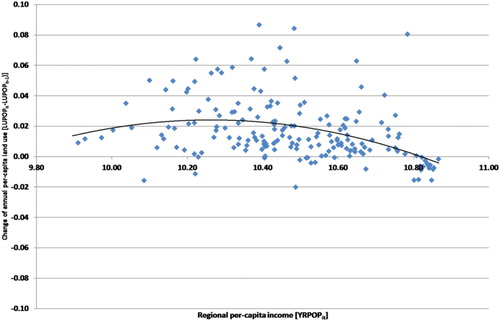
Table 3. Variables of the econometric estimations.
Figure 5. The changes in per-capita land consumption, and regional per-capita GDP (In all nine Federal Provinces excluding Vienna). See for a description of the variables. Source: Own draft and calculations based on UBA (Citation2017) and STAT (Citation2017).