Figures & data
Figure 1. Transport and land-use feedback cycle (Giuliano, Citation2004; Meyer & Miller, Citation2001; Wegener and Fürst, Citation1999).
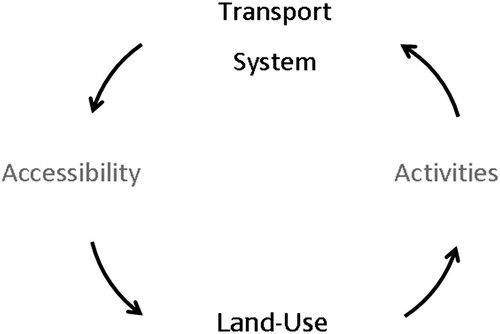
Figure 2. Mobility strategies are dominant while accessibility strategies get less attention (Handy, Citation2002).
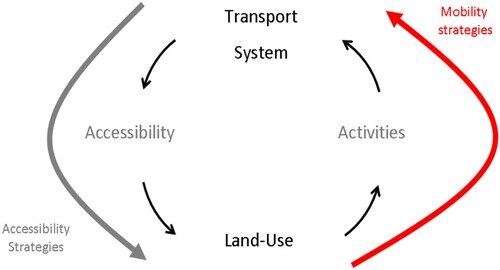
Table 1. Outline of the case study.
Figure 3. City of Almere and current planning strategies (adapted from Metropoolregio Amsterdam, Citation2009).

Table 2. Planning goals and accessibility requirements, as identified by the participants during the first workshop (Almere case).
Table 3. Average travel times on each spatial scale rounded off by 5 min intervals (Almere case).
Figure 4. (a) Access to population by car (30 min. inter-peak) – 2010; 10 classes or deciles, from dark grey (relative more opportunities) to light grey (relative less opportunities) – calculated with local and regional four step transport model. (b) Access to population by car (30 min. inter-peak) – 2030, scenario I: metropolitan connectivity – new bridge to Amsterdam; 10 classes, from dark grey (relative more opportunities) to light grey (relative less opportunities) – calculated with local and regional four step transport model. (c) Access to population by car (30 min. inter-peak) – 2030, scenario II: hub and spoke – new highway to the eastern part of the country; 10 classes, from dark grey (relative more opportunities) to light grey (relative less opportunities) – calculated with local and regional four step transport model.
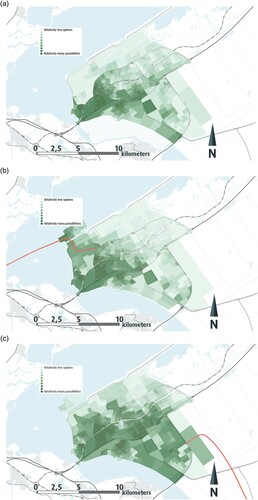
Figure 5. Map of Rotterdam including proposed transport and land-use plans. Numbers refer to the proposed new river-crossings discussed in Section 5.3.
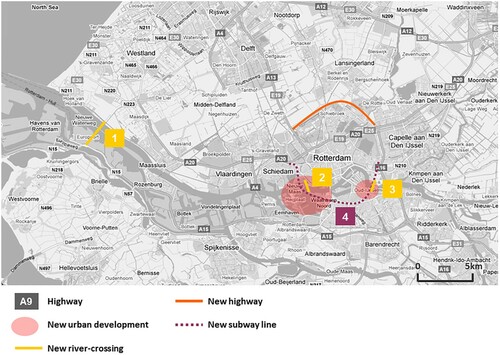
Table 4. Planning goals and accessibility requirements, as identified by the participants during the first workshop (Rotterdam case).
Table 5. Contour measures (Rotterdam case).
Figure 6. (a) Access to labour force by bike – 2006 – calculated with the RVMK model. (b) Access to jobs by bike – 2006 – calculated with the RVMK model.
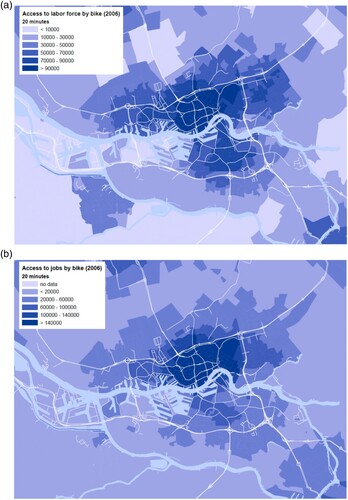
Figure 7. Access to jobs by car – 2006 – calculated with the RVMK model.
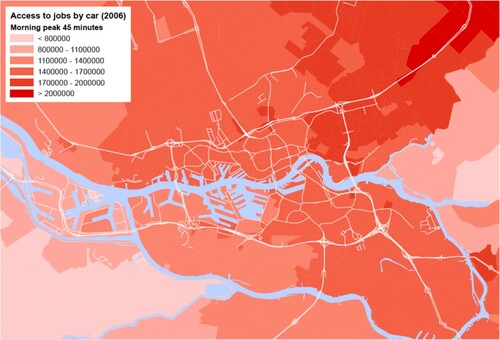
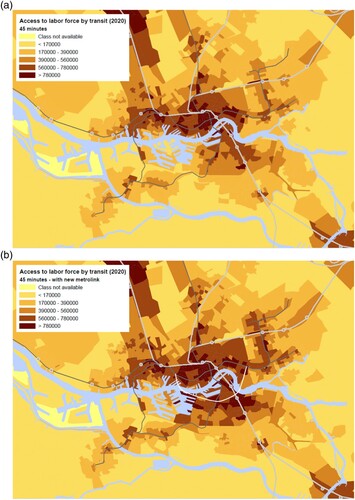
Figure 8. (a) Access to labour force 2020 by transit – base line scenario; existing subway lines are in dark grey, existing railways lines in light grey. – calculated with the RVMK model. (b) Access to labour force 2020 by transit – scenario new tangential subway (white line); existing subway lines are in dark grey, existing railways lines in light grey – calculated with the RVMK model.