Figures & data
Figure 1. The 100 landscapes once mapped show great differences among them.
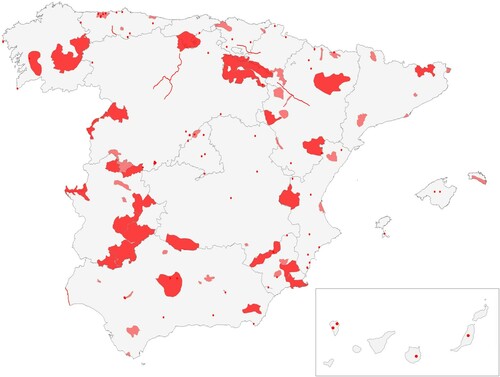
Table 1. List of landscape attributes used in the study.
Figure 2. Relationship between surface area and degree of heterogeneity of the 100 landscapes.
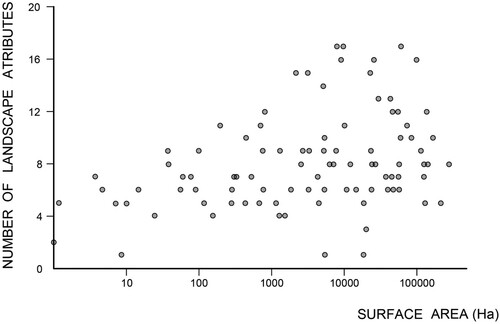
Figure 3. Average range of attributes and trends.
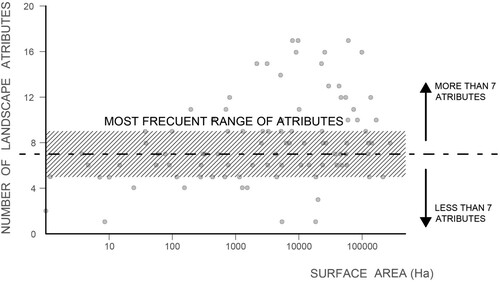
Figure 4. Division into zones according to surface area.
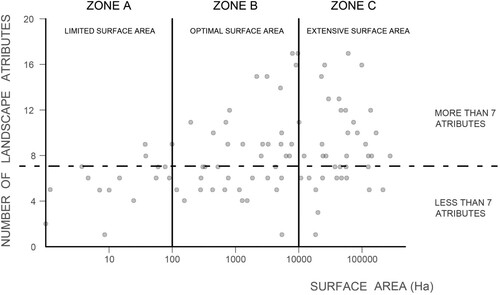
Figure 5. Tendencies of the different landscapes, with respect to surface area and number of attributes.
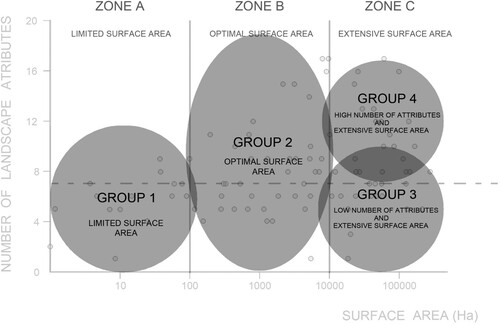
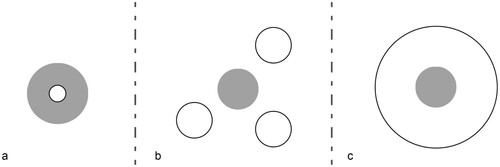
Figure 6. Derived relations between designated landscapes and territorial continuum: (a) Singular element that needs to include an area of influence; (b) Landscape designated because it best represents a clear typology and (c) Landscape designated because it represents the main characteristics of a bigger geographical entity.