
Figures & data
Figure 1. Stylized illustration of a cluster. Source: own illustration.
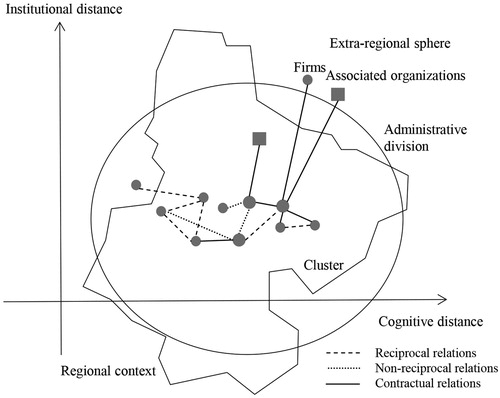
Figure 2. Stylized illustration of endogenous effects and network transition. Source: own illustration.
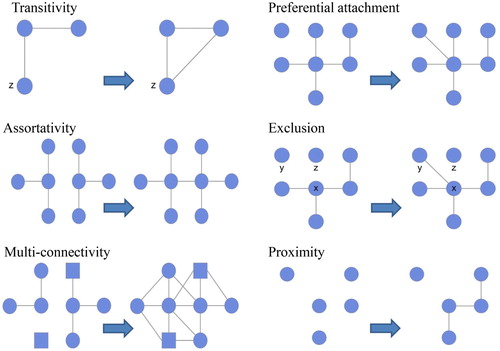
Figure 3. Stylized illustration of a cluster in the emerging phase. Source: own illustration.
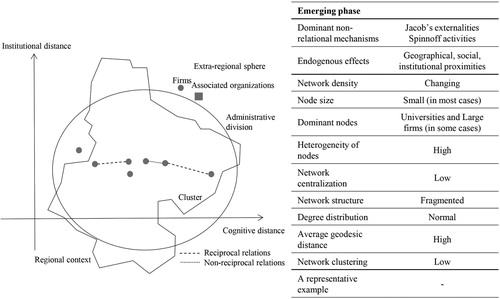
Figure 4. Stylized illustration of a cluster in the growing phase. Source: own illustration.
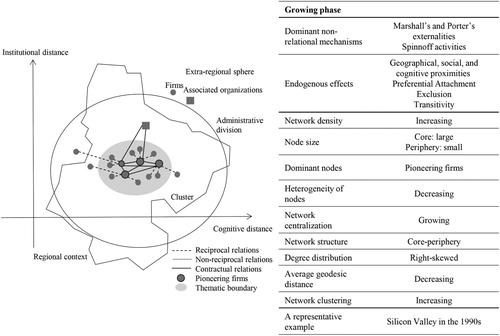
Figure 5. Stylized illustration of a cluster in the sustaining phase. Source: own illustration.
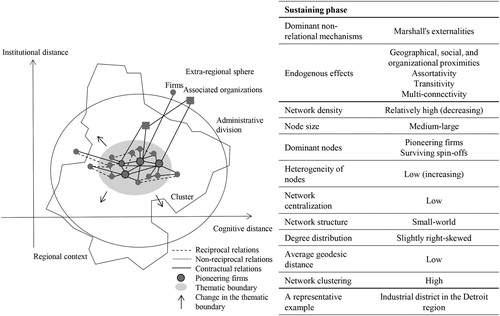
Figure 6. Stylized illustration of a cluster in the declining phase. Source: own illustration.
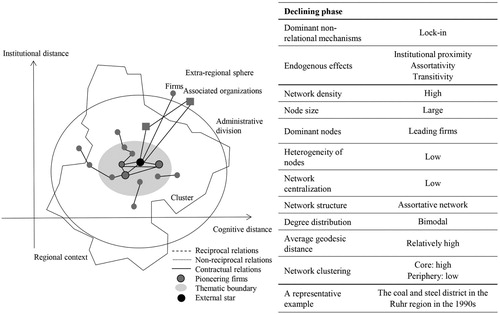
Figure 7. Overview of dominant endogenous effects along the cluster lifecycle. Source: own illustration using the circlize package in R (Gu, Gu, Eils, Schlesner, & Brors, Citation2014).
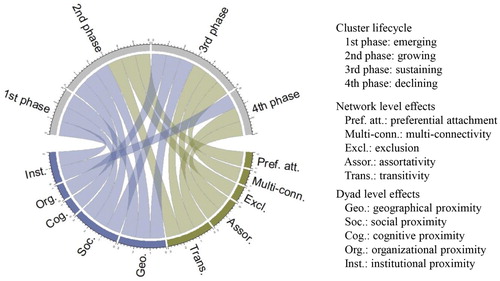
Table 1. Overview of relevant interventionist network-related policy approaches and measures.
Supplemental material