Figures & data
Figure 1. Urban living labs key stakeholders (UnaLab project).
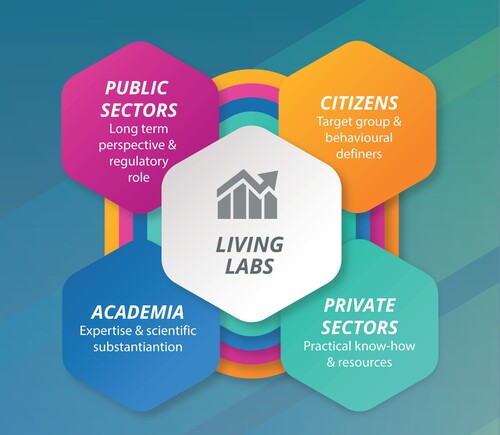
Table 1. Review of ULL literature.
Figure 2. Classification of innovation process phase of 90 potential living lab projects in the Amsterdam region (Steen and van Bueren Citation2017).
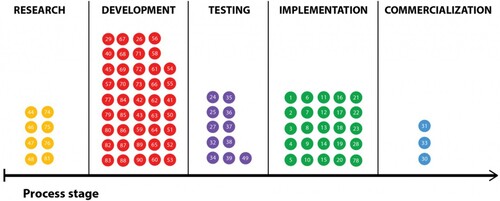
Table 2. Methodology.
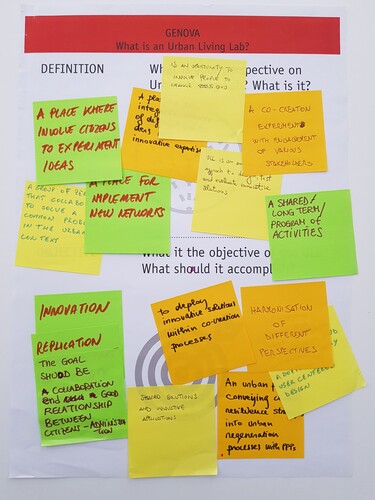
Figure 3. Participatory brainstorming session in Genova (The Authors).