Figures & data
Figure 1. Schematic visualization of deriving the inter-regional co-inventor network. Source: Own illustration.
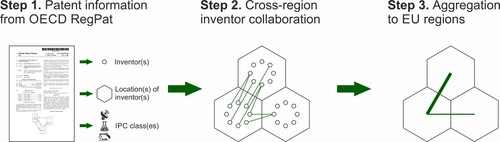
Figure 2. Schematic visualization of the network variables. Source: Own illustration.
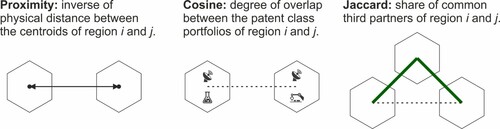
Table 1. Descriptive statistics and correlation of the standardized main explanatory variables.
Table 2. Characteristics of the co-inventor network and the repeated collaboration network.
Figure 3. Spatial patterns of inventor collaboration and repeated collaboration networks of European regions. Source: Own calculation based on OECD REGPAT 2015. Note: (A) The maximum spanning tree of the collaboration network across NUTS 3 regions in Europe reveals the importance of national centers. (B) Most of the repeated collaborations remain within country borders, and strongest ties are concentrated within close proximity of innovative hubs. (C) The 7 communities of the collaboration network span across countries, with the exception of Germany that is divided into two communities and Italy, but are mostly concentrated in large regions. (D) Repeated collaboration is organized into 23 smaller-scale clusters.
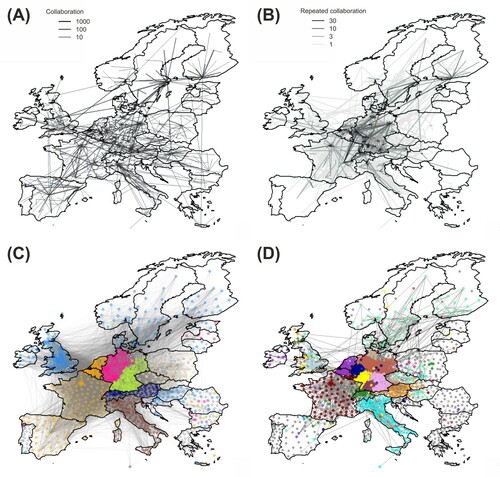
Figure 4. The probability of collaboration and repeated collaboration as a function of region-to-region characteristics. Source: Own calculation based on OECD REGPAT 2015. Note: (A) Distance () decay is smooth for geographically proximate collaboration and repeated collaboration, following a linear decay on log-log scale with the exponents −1.05 and −1.27 for distances larger than 100 km. (B) The overlap between technological profiles of regions, measured by cosine similarity (
), increases the probability of collaboration with a growing intensity as similarity rises. (C) The probability of collaboration grows linearly on a logarithmic scale as the share of common third connected regions, measured by Jaccard similarity (
), increases. The exponent is 3.86 for collaboration and 5.67 for repeated collaboration.
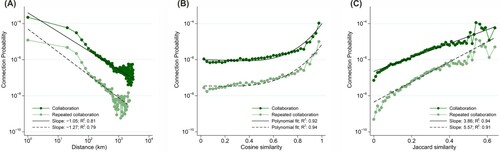
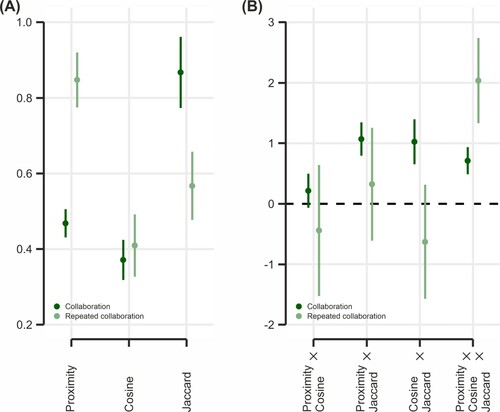
Figure 5. Results of the multivariate estimations. Source: Own calculation based on OECD REGPAT 2015. Note: (A) Considering single effects only, we observe that the probability of collaboration is mostly increased by common third partners, while repeated ties gain probability if regions are geographically proximate. (B) Interaction effects reveal that repeated ties gain extra probability if regions are geographically proximate, technologically similar and connected to the same set of regions at the same time.