
Figures & data
Figure 1. Circular development. Source: Williams (Citation2021b).
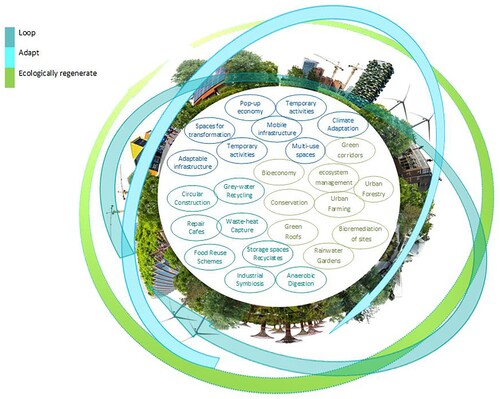
Figure 2. Benefits of circular development. Source: Author's own figures produced by Draught Vision Ltd.
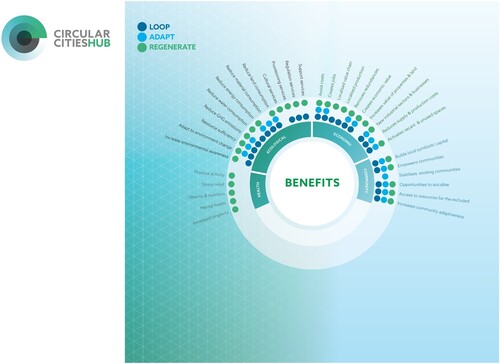
Figure 3. Challenges to implementation. Source: Author's own figures produced by Draught Vision Ltd.
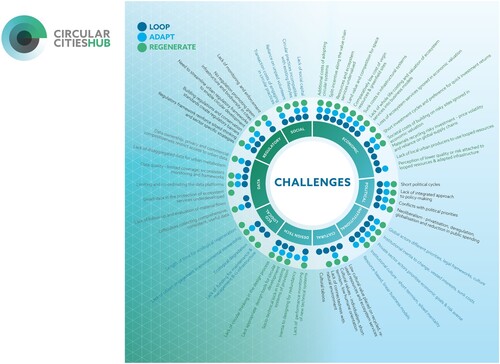
Table 1. Framework for categorizing the planning tools used to deliver circular development.
Table 2. Factors reducing the effectiveness of planning as a mechanism for circular transformation.
Table 3. Circular development coding framework.
Table 4. Key stakeholder interviews.
Table 5. Planning tools for delivering circular development.
Table 6. Environmental performance programmes.
Table 7. Factors reducing the effectiveness of planning in circular transformations identified by interviews.
Data availability statement
Data was obtained from third parties on the proviso the data was anonymized.