
Figures & data
Figure 1. Distribution of public landownership on 1/1/2020 among different public institution categories, further subdivided by zoning category.
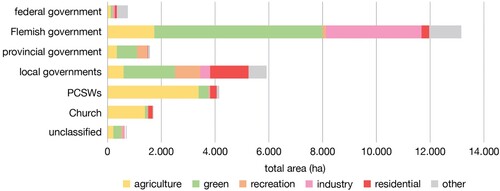
Figure 2. Share of extra-municipal PCSW landownership in agricultural and green areas for all municipalities in East Flanders on 1 January 2020.
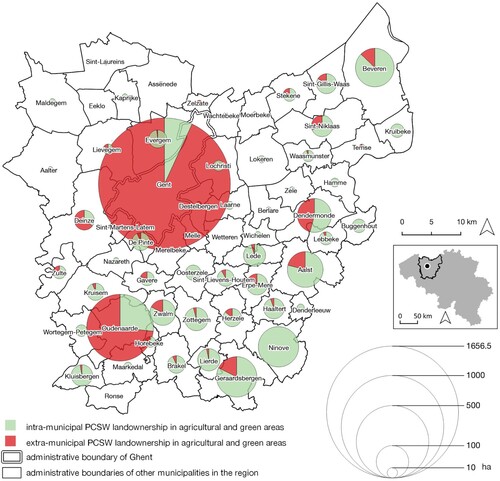
Figure 3. Relative evolution of public landownership between 2010 and 2020, further subdivided by public institution category.
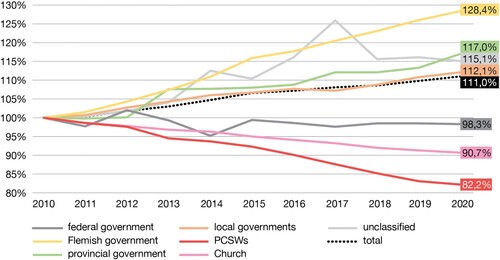
Figure 4. Overview of public land acquired and lost in the period 2010–2020 within each public institution category, further subdivided by zoning category.
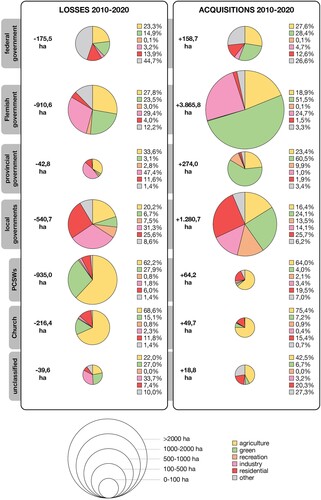
Figure 5. Heat map of public land acquired by all public institutions in green areas during 2010–2020 (weighted by plot area).
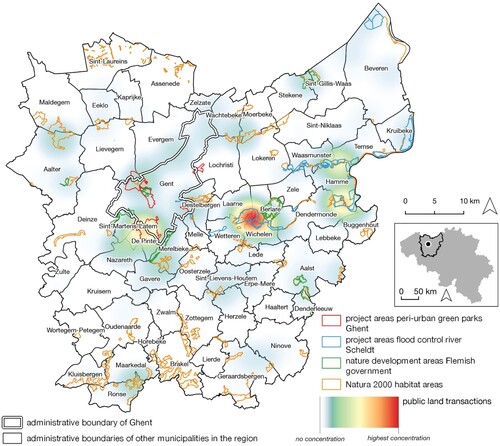
Figure 6. Destination of public land lost by PCSWs and the Church during 2010–2020.
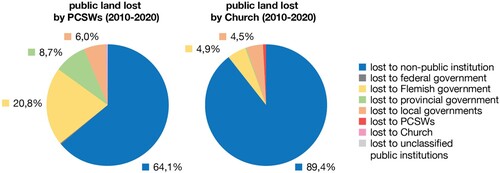
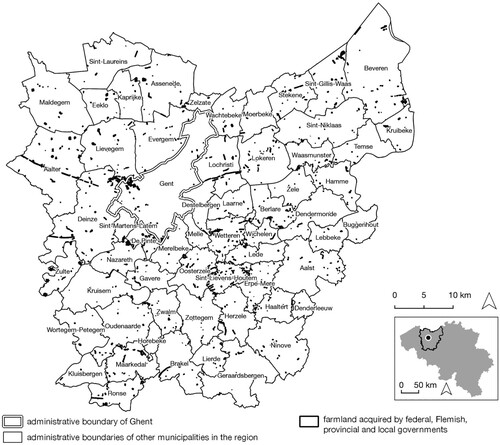
Figure 7. Public land acquired by the federal, Flemish, provincial and by local governments in agricultural areas during 2010–2020.
Data availability statement
The original data that support the findings of this study are available from the Belgian Land Registry. These data are not publicly accessible, but can be requested based on the principle of open government provided for in the Belgian Constitution.