Figures & data
Figure 1. The conceptual framework of data collection and data enrichment using the activity space approach to reveal cross-border mobilities and its motives from an individual perspective.
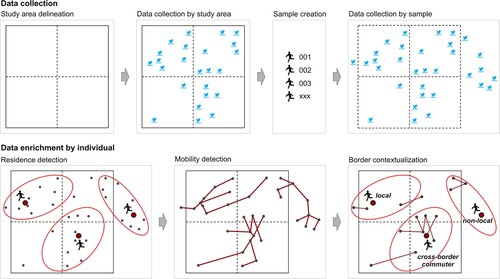
Figure 2. The study area of Luxembourg situated within the official delineation of the Greater Region of Luxembourg, and our extended GRL definition used in this study.
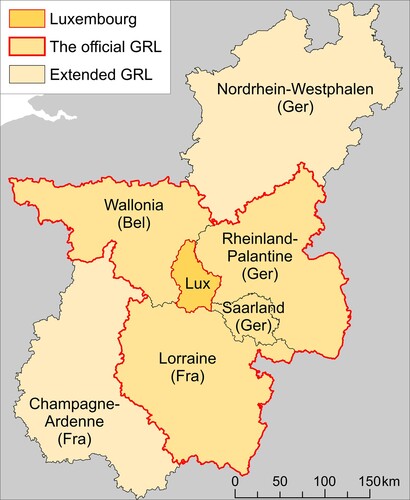
Table 1. Description of used Twitter data.
Table 2. Description of movement data from Twitter users visiting Luxembourg by movement type.
Table 3. Distribution of Twitter users crossing borders of Luxembourg by their place of residence.
Figure 3. The correlation between cross-border workers from official registry data (Statec Citation2021) and daily border crossers from Twitter data at municipality level, n = 72, (A), and kernel density (radius 10 km) estimation of commuters’ residential locations from Twitter data (B).
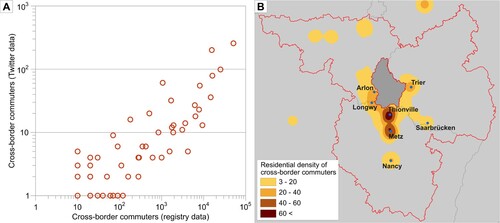
Table 4. Distribution of movements crossing Luxembourg’s borders by place of residence and border section with neighbouring country during the study period.
Figure 4. Yearly division of cross-border mobility of Luxembourg that remain within the GRL by border crosser type (A), and the relative proportion of cross border mobility of daily commuters by border section of Luxembourg (B).
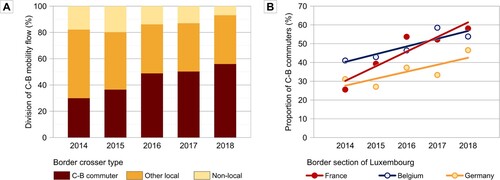
Figure 5. Monthly (A) and weekday (B) variations of mobility crossing the borders of Luxembourg from the average by border crosser type. Cross-border mobility is limited to movements that remain within the GRL.
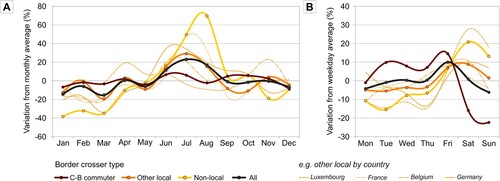
Figure 6. Distribution of cross-border mobility distances by border crosser type (A), by the residence country of cross-commuters (B) and by the residence country of other local people residing within the GRL (C).
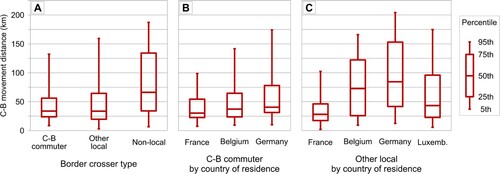
Figure 7. Difference between weekday median distance of cross-border trips compared to overall median distance of cross-border trips in case of border crosser type and all trips together.

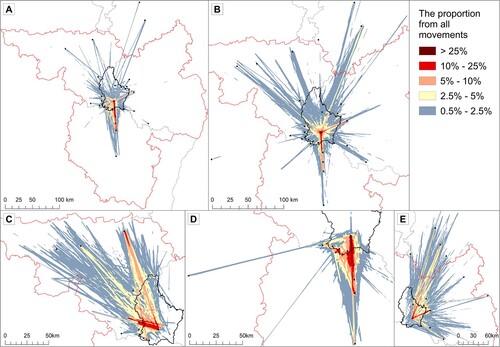
Figure 8. The estimated geographical distribution of cross-border mobility flows crossing the borders of Luxembourg from Twitter data by cross-border commuters (A) and locals residing in Luxembourg (B), Belgium (C), France (D) and Germany (E). The proportional value indicates how many movements were located within the closest 3 km2.