Figures & data
Figure 1. Cross-border Loughs and jurisdictional ownership issues on the IOI.
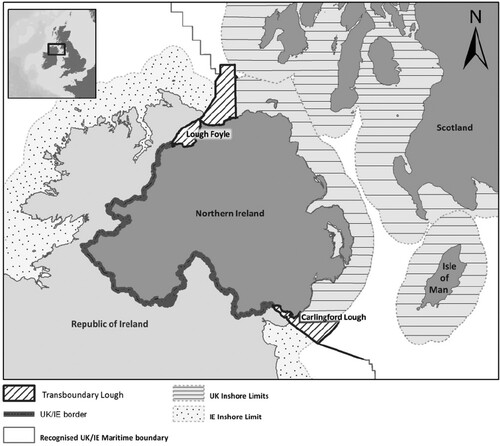
Table 1. Dimensions of institutional integration forming the analytical framework for the study.
Table 2. Breakdown and number of Interviewees.
Figure 2. Republic of Ireland Marine Plan Area.Source: Adapted from DHLGH (Citation2021) to show the undefined border and contested area in dashed circles.
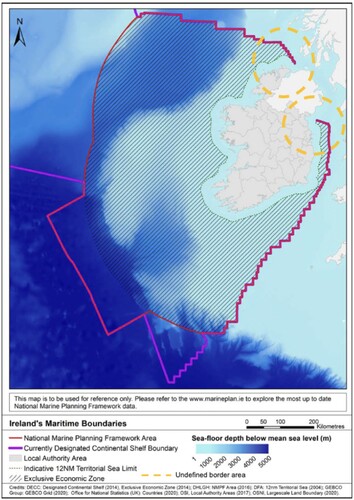
Figure 3. The Pomeranian Bay and unclear maritime border at the northern approach to seaports in Poland highlighted in deep dashed lines.
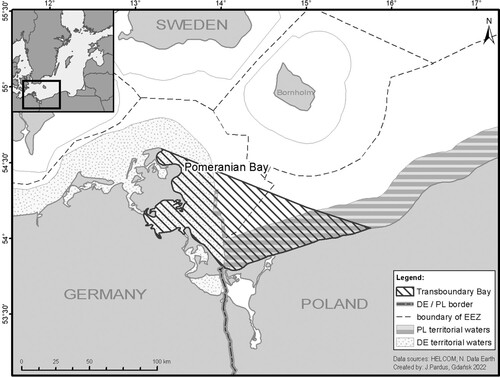
Figure 4. The Maritime Spatial Plan of Polish Sea Areas on a scale of 1: 200,000.
Source: Adapted from Polish Maritime Administration (Citation2021) to highlight the port function designation for the contested area.
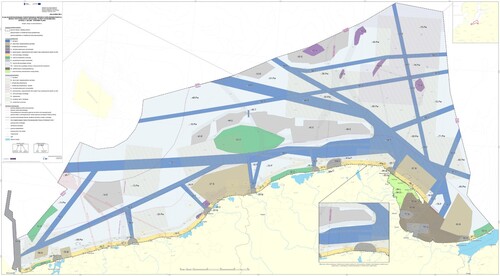
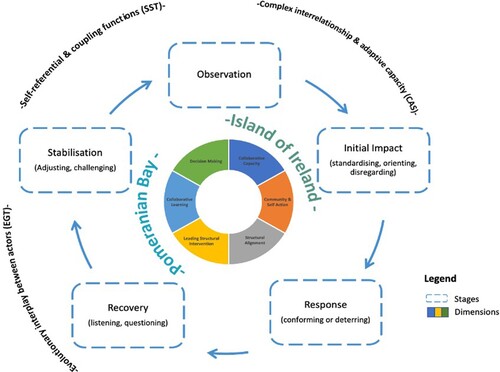
Figure 5. Stages of cross-border MSP integration in the Island of Ireland and Pomeranian Bay.
Source: Adapted from Ansong et al. (Citation2021).