
Figures & data
Table 1. A simplified inter-regional input-output table.
Figure 1. TVCI by region during 2008–2010.
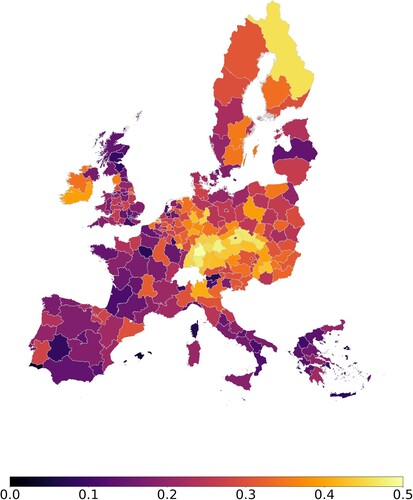
Table 2. Summary statistics of the variables.
Table 3. Correlation of the variables.
Figure 2. Correlation between TVCI and GVA with regression line.
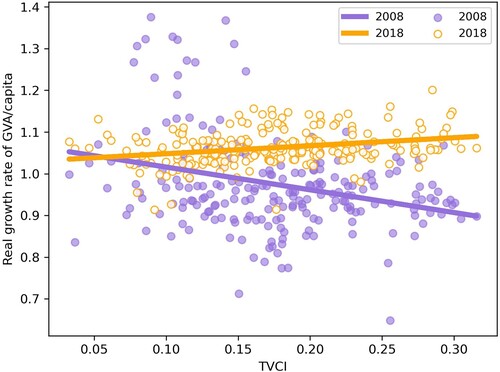
Table 4. Regression results with country level clustered standard errors.
Table 5. Regression results with country level clustered standard errors 2.
Supplemental material