Figures & data
Figure 1. Flowchart of the procedure in Experiment 1.
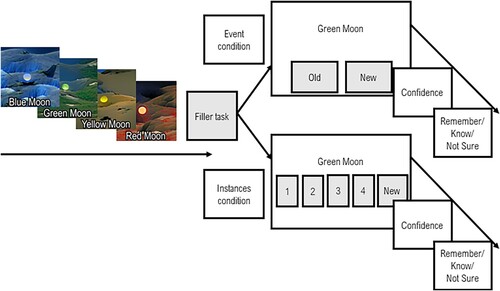
Figure 2. Hit response latencies (transformed) across instances and conditions in Experiment 1.
Note. Points represent individual response latencies per participant and instance following preregistered exclusion of values ± 2SD and power transformation. Box plots present medians and upper and lower quartiles. Black points with error bars present means and 95% CIs, and black points at the top of the distributions represent outlier values.
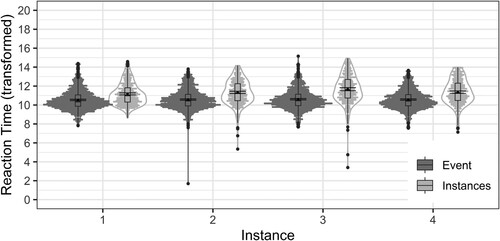
Table 1. Reaction time (non-transformed) and confidence ratings across recognition decisions, conditions, and instances in Experiment 1.
Table 2. Proportions of memory judgments across conditions, instances, and experiments.
Table 3. Proportions of recognition decisions across conditions and instances in Experiment 1.
Figure 3. Confidence-based receiver-operating characteristic curves for hit and false alarm rates across instances and between conditions in Experiment 1.
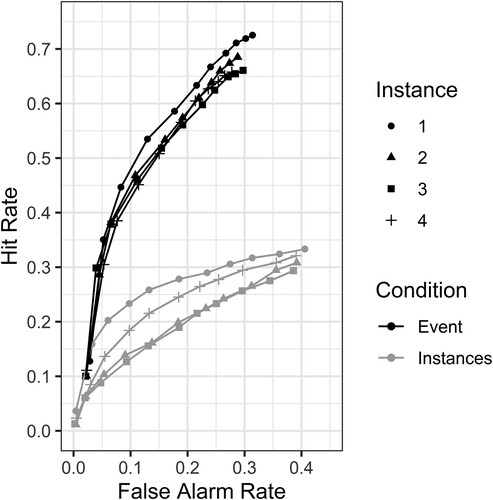
Figure 4. Confidence-based receiver-operating characteristic curves for hit and misattribution rates (instances condition/task) across instances in Experiments 1 and 2.
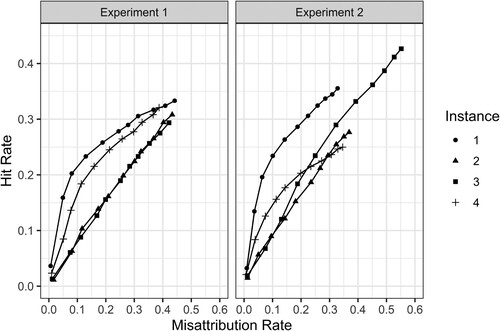
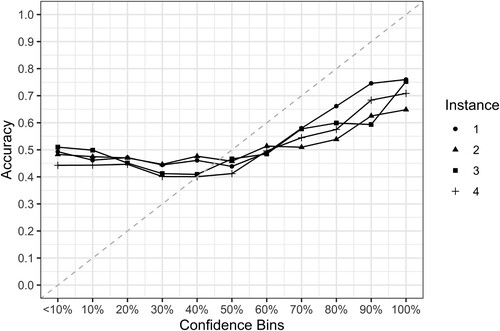
Figure 5. Confidence-accuracy calibration curves between conditions and across instances in Experiment 1.
Note. Dashed reference line represents perfect calibration.
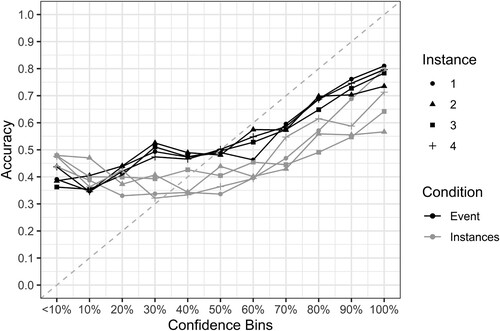
Table 4. Reaction time (non-transformed) and confidence ratings across recognition decisions, tasks, and instances in Experiment 2.
Table 5. Proportions of recognition decisions across conditions and instances in Experiment 2.
Figure 6. Confidence-accuracy calibration curves between conditions and across instances in Experiment 2.
Note. Dashed reference line represents perfect calibration.