Figures & data
Table 1. Operationalisation of risk vs. threat-based security logics. Adopted from Corry (Citation2012, pp. 248–249) in terms of categories and key indicators for risk and threat-based security logics, respectively. Coded words have been added by the author for the content analysis part of the study.
Figure 1. Weighted Percentage (%) – frequency of the word relative to the total words counted in the EU security strategies, respectively (2015 and 2020).
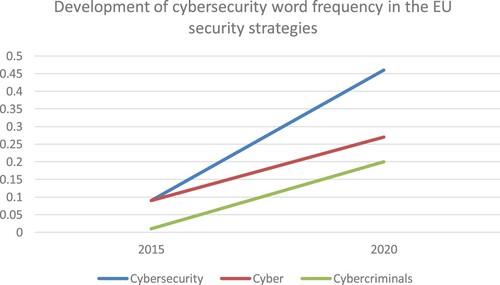
Figure 2. Words coded as indicators of a risk-based security logic. Weighted Percentage (%) – frequency of the word relative to the total words counted in the EU cybersecurity strategies, respectively (2013 & 2020).
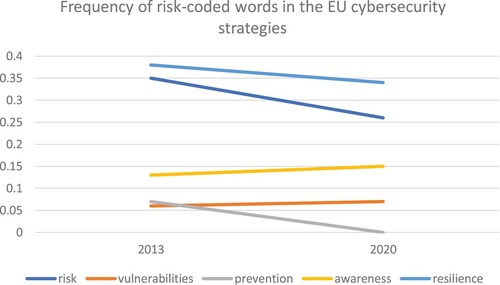
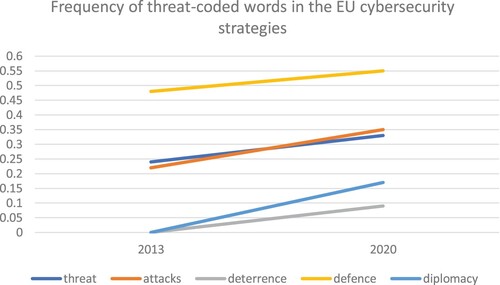
Figure 3. Words coded as indicators of a threat-based security logic. Weighted Percentage (%) – frequency of the word relative to the total words counted in the EU cybersecurity strategies, respectively (2013 & 2020).