1,593
Views
14
CrossRef citations to date
0
Altmetric
Original Articles

Flow cytometric analysis of the encystment process induced by paraquat exposure in Haematococcus pluvialis (Chlorophyceae)

, , &
Pages 89-97 | Received 23 Feb 2010, Accepted 22 Jan 2011, Published online: 08 Apr 2011

Figures & data

Fig. 1. Biparametric histograms of H. pluvialis cultures: astaxanthin fluorescence (FL2, 575 ± 15 nm; arbitrary units) vs chlorophyll a fluorescence (FL4, 675 ± 25 nm; arbitrary units). Analysis of flow cytometric data of H. pluvialis cultures after 96 h exposure to 0 nM (a) and 600 nM (b) of paraquat using chlorophyll a fluorescence to gate non-microalgal particles. Scale bar: 10 µm.
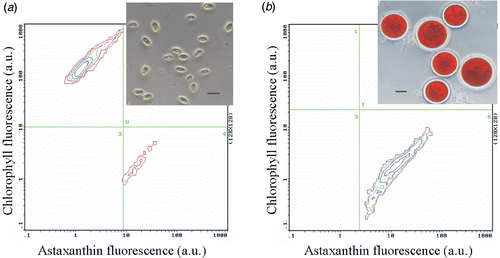
Fig. 1. Biparametric histograms of H. pluvialis cultures: astaxanthin fluorescence (FL2, 575 ± 15 nm; arbitrary units) vs chlorophyll a fluorescence (FL4, 675 ± 25 nm; arbitrary units). Analysis of flow cytometric data of H. pluvialis cultures after 96 h exposure to 0 nM (a) and 600 nM (b) of paraquat using chlorophyll a fluorescence to gate non-microalgal particles. Scale bar: 10 µm.

Fig. 2. Evolution of astaxanthin-rich subpopulation analysed by FCM in cultures of H. pluvialis exposed to different concentrations of paraquat. Results are expressed as the percentage of astaxanthin-rich cells in each culture with respect to microalgal population. Black and white bars indicate dark and light periods, respectively.
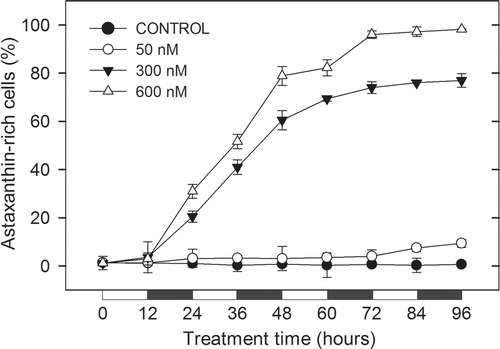
Fig. 2. Evolution of astaxanthin-rich subpopulation analysed by FCM in cultures of H. pluvialis exposed to different concentrations of paraquat. Results are expressed as the percentage of astaxanthin-rich cells in each culture with respect to microalgal population. Black and white bars indicate dark and light periods, respectively.

Fig. 3. Chlorophyll a fluorescence (a), astaxanthin fluorescence (b) and size (c), analysed by FCM of chlorophyll-rich cells in cultures of H. pluvialis exposed to different concentrations of paraquat. Black and white bars indicate dark and light periods, respectively. a.u., arbitrary units.
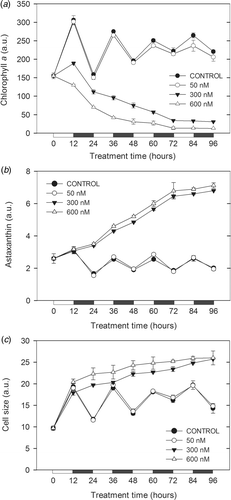
Fig. 3. Chlorophyll a fluorescence (a), astaxanthin fluorescence (b) and size (c), analysed by FCM of chlorophyll-rich cells in cultures of H. pluvialis exposed to different concentrations of paraquat. Black and white bars indicate dark and light periods, respectively. a.u., arbitrary units.
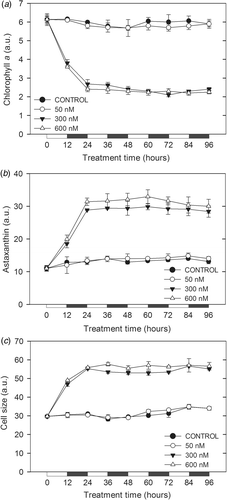
Fig. 4. Chlorophyll a fluorescence (a), astaxanthin fluorescence (b) and size (c), analysed by FCM of astaxanthin-rich cells in cultures of H. pluvialis exposed to different concentrations of paraquat. Black and white bars indicate dark and light periods, respectively. a.u., arbitrary units.
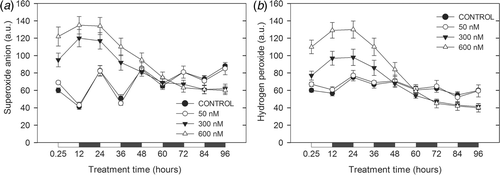
Fig. 4. Chlorophyll a fluorescence (a), astaxanthin fluorescence (b) and size (c), analysed by FCM of astaxanthin-rich cells in cultures of H. pluvialis exposed to different concentrations of paraquat. Black and white bars indicate dark and light periods, respectively. a.u., arbitrary units.
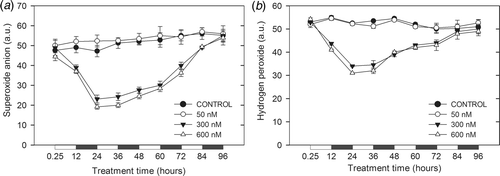
Fig. 5. Intracellular generation of superoxide radical (a) and hydrogen peroxide (b), analysed by FCM of chlorophyll-rich cells in cultures of H. pluvialis exposed to different concentrations of paraquat. Black and white bars indicate dark and light periods, respectively. a.u., arbitrary units.

Fig. 5. Intracellular generation of superoxide radical (a) and hydrogen peroxide (b), analysed by FCM of chlorophyll-rich cells in cultures of H. pluvialis exposed to different concentrations of paraquat. Black and white bars indicate dark and light periods, respectively. a.u., arbitrary units.

Fig. 6. Intracellular generation of superoxide radical (a) and hydrogen peroxide (b), analysed by FCM of astaxanthin-rich cells in cultures of H. pluvialis exposed to different concentrations of paraquat. Black and white bars indicate dark and light periods, respectively. a.u., arbitrary units.

Fig. 6. Intracellular generation of superoxide radical (a) and hydrogen peroxide (b), analysed by FCM of astaxanthin-rich cells in cultures of H. pluvialis exposed to different concentrations of paraquat. Black and white bars indicate dark and light periods, respectively. a.u., arbitrary units.

Fig. 7. Correlation between chlorophyll a content (•) or cell size () parameters and accumulated intracellular astaxanthin in chlorophyll-rich cells during 96 h of exposure to 600 nM of paraquat. The relation between chlorophyll content and astaxanthin content was characterized by an exponential decay function (solid line; R 2 = 0.92), whereas the relation between cell size and astaxanthin content was asymptotic, characterized by an exponential rise to maximum function (dash-dot line, R 2 = 0.95). a.u., arbitrary units.
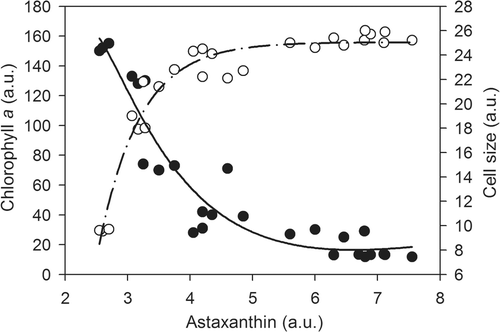
Fig. 7. Correlation between chlorophyll a content (•) or cell size (○) parameters and accumulated intracellular astaxanthin in chlorophyll-rich cells during 96 h of exposure to 600 nM of paraquat. The relation between chlorophyll content and astaxanthin content was characterized by an exponential decay function (solid line; R 2 = 0.92), whereas the relation between cell size and astaxanthin content was asymptotic, characterized by an exponential rise to maximum function (dash-dot line, R 2 = 0.95). a.u., arbitrary units.

Fig. 8. Correlation between superoxide anion (•) or hydrogen peroxide () levels and accumulated intracellular astaxanthin in chlorophyll-rich cells during 96 h of exposure to 600 nM of paraquat. Both are linear regressions, represented by a solid line for the superoxide anion (R 2 = 0.94) and dash-dot line for hydrogen peroxide (R 2 = 0.89). a.u., arbitrary units.
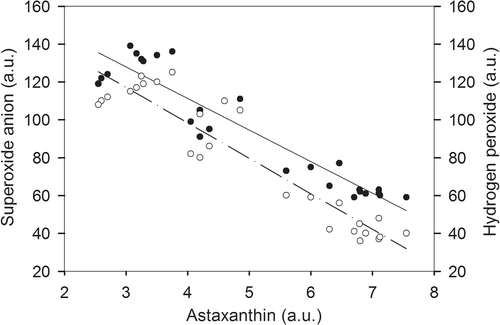
Fig. 8. Correlation between superoxide anion (•) or hydrogen peroxide (○) levels and accumulated intracellular astaxanthin in chlorophyll-rich cells during 96 h of exposure to 600 nM of paraquat. Both are linear regressions, represented by a solid line for the superoxide anion (R 2 = 0.94) and dash-dot line for hydrogen peroxide (R 2 = 0.89). a.u., arbitrary units.

Reprints and Corporate Permissions

Please note: Selecting permissions does not provide access to the full text of the article, please see our help page How do I view content?

To request a reprint or corporate permissions for this article, please click on the relevant link below:

Academic Permissions

Please note: Selecting permissions does not provide access to the full text of the article, please see our help page How do I view content?

Obtain permissions instantly via Rightslink by clicking on the button below:

If you are unable to obtain permissions via Rightslink, please complete and submit this Permissions form. For more information, please visit our Permissions help page.