Figures & data
Fig. 1. Haemolytic activities of cell suspension (○) and cell-free culture supernatant (●) of Heterocapsa circularisquama (A), Alexandrium tamiyavanichii (B), Karenia mikimotoi (C), Chattonella marina (D) and C. antiqua (E). Cell suspensions or supernatants equivalent to the indicated cell concentration of each species were mixed with rabbit erythrocytes. After 5 h incubation at 26°C, the extents of haemolysis were measured. Each point represents the mean of triplicate measurements, ± SD (%).
Fig. 2. Heat-stability of the haemolytic activities of cell-free culture supernatant of A. tamiyavanichii (A) and H. circularisquama (B). The cell-free supernatant of each species was treated at 0 (○), 27 (△), 37 (□) and 60°C (◇) for the indicated periods of time, and then the haemolytic activities were measured. Each point represents the mean of triplicate measurements, ± SD (%).
Fig. 3. Effects of various saccharides on the haemolytic activities of the cell-free culture supernatants of H. circularisquama (□) and A. tamiyavanichii (■). In the absence (control) or presence of the indicated saccharides at 10 mM, the haemolytic activities of the cell-free culture supernatants of each species were measured. The activity was expressed as % of control (100%) without the saccharides. Data are means ± SD (%) of triplicate measurements. Asterisks indicate significant differences between the absence (control) and presence of saccharides (*p<0.05).
Fig. 4. L-012-mediated chemiluminescence responses of C. marina (△, ▲), C. antiqua (○, ●) and H. circularisquama (□, ■) (A), K. mikimotoi (□, ■) and A. tamiyavanichii (○, ●) (B). Cell suspensions of C. marina (1×10⁴ cells ml–1), C. antiqua (1×10⁴ cells ml–1), H. circularisquama (105 cells ml–1), A. tamiyavanichii (2×10³ cells ml–1), and K. mikimotoi (1×10⁴ cells ml–1) were subjected to L-012-mediated chemiluminescence analysis in the presence (●,▲,■) or absence (○,△,□) of SOD (100 U ml–1).
Fig. 5. Hydrogen peroxide (H2O2) levels in the cell suspensions of C. marina (1×10⁴ cells ml–1), C. antiqua (1×10⁴ cells ml–1), H. circularisquama (1×10⁵ cells ml–1), K. mikimotoi (1×10⁴ cells ml–1) and A. tamiyavanichii (2×10³ cells ml–1). Cell suspension of each species was subjected to PHPA-H2O2 detection assay in the absence (□) or presence (■) of catalase (100 U ml–1). Each column represents the mean of triplicate measurements ± SD.
Fig. 6. Effects of C. marina, C. antiqua, H. circularisquama, K. mikimotoi and A. tamiyavanichii on the rotifer Brachionus plicatilis. After exposure to cell suspension of C. marina (1×10⁴ cells ml–1) (○), C. antiqua (1×10⁴ cells ml–1) (△), H. circularisquama (1×10⁵ cells ml–1) (■), A. tamiyavanichii (2×10³ cells ml–1) (□) or K. mikimotoi (1×10⁴ cells ml–1) (▲), the number of viable rotifers was counted at the indicated times. Each point represents the mean of triplicate measurements ± SD.
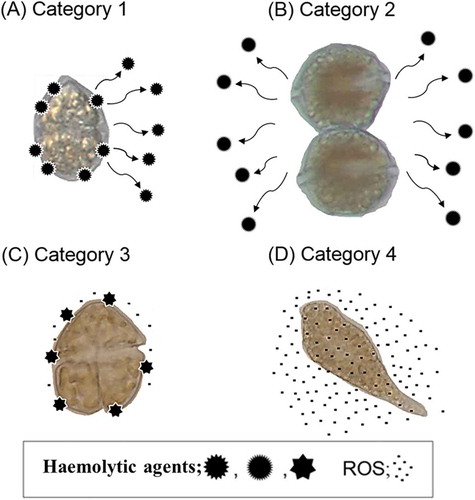
Fig. 7. Schematic illustrations of the presence of the haemolytic agents and ROS production in H. circularisquama (A), A. tamiyavanichii (B), K. mikimotoi (C) and Chattonella spp. (D). In H. circularisquama, some of the haemolytic agents are secreted extracellularly and some are bound on the cell surface. In A. tamiyavanichii, almost all the haemolytic agents are secreted extracellularly. In K. mikimotoi, almost all the haemolytic agents are bound on the cell surface, and low levels of ROS are produced. In Chattonella spp., there is no haemolytic agent, but high levels of ROS are produced.