
Figures & data
Table 1. Species information.
Figs 1–9. Light micrographs of the species used in this study. , Navicula arenaria var. rostellata; , Craspedostauros britannicus; , Seminavis robusta; , Entomoneis paludosa; , Navicula phyllepta; , Planothidium delicatulum; , Biremis lucens; , Nitzschia cf. frustulum; , Opephora guenter-grassii. Scale bar = 10 µm.
Fig. 10. A schematic overview of artificial biofilm preparation.
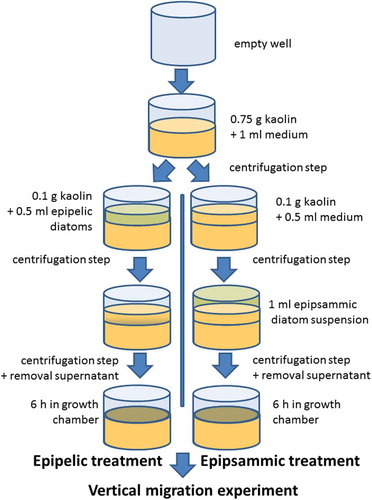
Fig. 11. The linear regression of the Normalized Difference Vegetation Index (NDVI) with chlorophyll a content, determined spectrophotometrically, on a Phaeodactylum tricornutum dilution series centrifuged on kaolin.
Fig. 12. The decrease in surface biomass, measured as NDVI, of epipelic diatoms (a) and epipsammic diatoms (b) on kaolin during 30 min of HL. Note that the y-axis in these plots starts at 50%. Non-photochemical quenching (NPQ) for epipelic diatoms (c) and epipsammic diatoms (d), measured during 30 min HL and 30 min LL recovery. Values represent averages of three independent measurements ± standard deviations.
Fig. 13. The quantum yield of PSII (ΔF/Fm’), after 30 min of HL and 30 min of LL recovery, expressed in percentage of the maximal photosynthetic efficiency of PSII (Fv/Fm) before HL exposure for epipelic (black bars) and epipsammic diatoms (white bars). Values represent averages of three independent measurements ± standard deviations.
Fig. 14. The extent of vertical migration (measured as the decrease in surface biomass in percentage, cf. )], measured after 30 min of HL in function of the NPQ capacity, measured after 5 min of HL to avoid the effect of photoinhibition for epipelic (black symbols) and epipsammic diatoms (white symbols). Three replicates per species are plotted.
![Fig. 14. The extent of vertical migration (measured as the decrease in surface biomass in percentage, cf. Fig. 12a, b)], measured after 30 min of HL in function of the NPQ capacity, measured after 5 min of HL to avoid the effect of photoinhibition for epipelic (black symbols) and epipsammic diatoms (white symbols). Three replicates per species are plotted.](/cms/asset/5d79eb04-be08-4d6f-9fbb-e321b419f857/tejp_a_1397197_f0006_b.gif)