Figures & data
Table 1. Monosaccharide composition (mol%) of the different extracts from Halamphora luciae cells cultured in f/2 medium. Data are expressed as media ± SD.
Table 2. Average molecular weights obtained for MALDI mass spectrometry of Halamphora luciae extracts in f/2 medium.
Fig. 1. MALDI mass spectra of the (a) room temperature (RTW) and (b) hot water (W 100) extraction from Halamphora luciae cells grown in f/2 medium. Matrix: DHBA-SA mixture.
Table 3. Composition (mol %) of monosaccharide produced by methylation and hydrolysis of the RTW extract from Halamphora luciae. Data are expressed as media ± SD.
Table 4. Constituent monosaccharide (mol%) of extracts obtained from the hydrolysates of entire cells of Halamphora luciae cultured in f/2, f/2-N and f/2-P media. Data are expressed as media ± SD.
Table 5. Average molecular weights obtained for MALDI mass spectrometry of Halamphora luciae cells in different culture conditions and culture ages.
Fig. 2. MALDI mass spectra of Halamphora luciae cells under different culture media harvested at day 15. (a) f/2 (control), (b) f/2-N and (c) f/2-P. Matrix: CHCA.
Fig. 3. (a) Distribution of the polymerization of the polymers from Halamphora luciae cells grown in f/2 medium (black circles), f/2-N (white circles) and f/2-P (white triangles), (b) Cells grown in f/2 medium and harvested at days 5 (black circles), 10 (white circles), 15 (black triangles), 25 (white triangles) and 35 (black squares). The relative abundance was based on the polymer with the most abundant ion, which was represented as one unit in the curve.
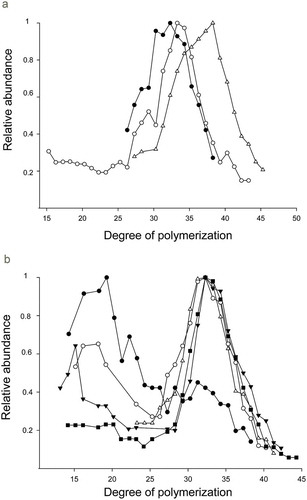
Fig. 4. MALDI mass spectra of Halamphora luciae cells growth in f/2 medium harvested at days (a) 5, (b) 10, (c) 15, (d) 25 and (e) 35. Matrix: SA.
Figs 5–7. Halamphora luciae cells cultured in f/2 medium and stained with aniline blue. Fig. 5. Arrows in the light micrographs indicate the chloroplast. Figs 6-7. Fluorescence micrographs with (Fig. 6) blue filter (Ex 450–490 nm, 510 nm FT, and Em 520 nm) showing chlorophyll autofluorescence (black arrow) and (Fig. 7) with UV filter (Ex 330–380 nm, FT 400 nm, Em 420 nm) without chlorophyll autofluorescence. In Figs 6-7 the brighter fluorescence at the girdle bands indicates the presence of a β-1,3 glucan (white arrows). Scale = 10 μm.