Figures & data
Fig. 1 Experimental analysis of Gelidium lingulatum: (a) geographic location of sampling sites along the Chilean coast, (b) annual mean values of photosynthetically active radiation (PAR) at seaweed sampling sites, (c) view of G. lingulatum growing on shells during acclimatization to outdoor conditions, (d) view of seaweed thallus where the rectangle indicates the sector used for photosynthesis and bacterial analysis, (e) view of bacterial community on the thallus surface of G. lingulatum using SEM
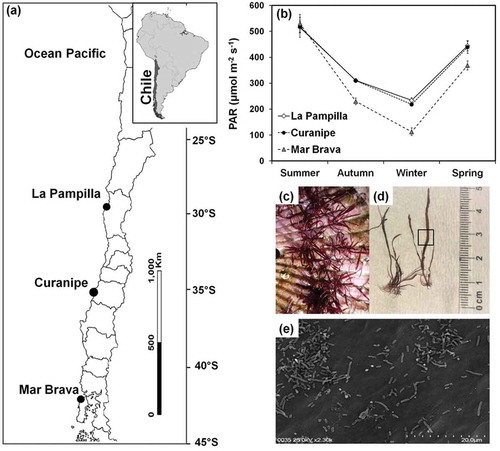
Table 1. Results of the two-way ANOVA with repeated measurements for the between-subject effects of the factors Population (La Pampilla, Maitencillo and Mar Brava) and the within-subject factor Time (days of experimentation) on: (a) Inhibition of maximal quantum yield (Fv/Fm) after 2 h of exposure, and (b) Fv/Fm under recovery (values as % of control). * indicates significant differences
Fig. 2 Changes in percentages of inhibition and recovery of maximum quantum yield (Fv/Fm) of G. lingulatum populations. (a) UV-induced inhibition of Fv/Fm after 2 h of exposure (calculated as the decrease in per cent of the mean Fv/Fm value of the corresponding control under PAR), and (b) Fv/Fm as percentage of the corresponding control after 19 h of recovery post UV-exposure. Values are mean (n = 3) ± SD. Values that are significantly different (Tukey, ANOVA) between each other at p < 0.05 are indicated by different letters above the bars. Similar values are joined by a horizontal line
Table 2. Results of the two-way ANOVA for the factors Population (La Pampilla, Maitencillo and Mar Brava) and Radiation Condition (initial before start experiment, and after 5 days under PAR and PAR+UV) on densities of bacteria (cell mm–2)
Fig. 3 The densities (cells mm–2) of bacteria on Gelidium lingulatum thalli. Initial – acclimated thalli samples before the experiment. UV – thalli exposed to PAR+UV. Control – thalli exposed to PAR only. Field – field thalli samples. Values are mean ± SD (n = 12). Different letters above the bars indicated significant differences according to the Tukey post hoc test at p < 0.05
Fig. 4 Hierarchical agglomerative clustering based on Bray–Curtis similarity of microbial communities associated with Gelidium lingulatum thalli from La Pampilla before (initial) and after the experiment (UV and control) and present in seawater during the period of the study. Field – microbial communities associated with field seaweeds. Individual replicates denominated by different numbers (1–3)
Table 3. Diversity of microbial communities (mean ± SD) associated with Gelidium lingulatum thalli from La Pampilla before (initial) and after the experiment (UV and control) and present in seawater during the period of the study. Field – microbial communities associated with field thalli. Individual replicates denominated by different numbers (1–3). Different letters indicated significant differences according to the LSD post hoc test at p < 0.05
Fig. 5 The main classes of bacteria associated with Gelidium lingulatum from La Pampilla before (S) and after the experiment and present in seawater (SW) during the period of the study. F – microbial communities associated with field thalli. C – microbial communities on control (just PAR). UV – microbial communities on thalli that were exposed to PAR+UV. Data are the mean percentage (n = 3) of OTUs belonging to classes of bacteria
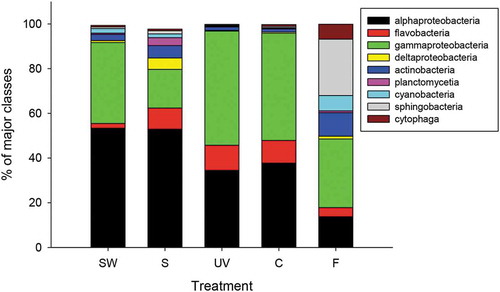
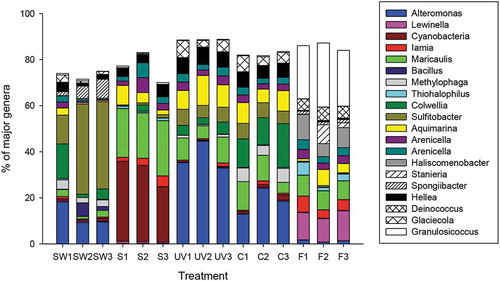
Fig. 6 The main genera of bacteria (> 5% of total abundance) associated with Gelidium lingulatum from La Pampilla before (S) and after the experiment and present in seawater (SW) during the period of the study. F – microbial communities associated with field thalli. C – microbial communities on control thalli (just PAR). UV – microbial communities on thalli that were exposed to PAR+UV. Different replicates denominated by different numbers