Figures & data
Fig. 1. Sampling locations of Corallina officinalis across the latitudinal distributional gradient in the North-east Atlantic: IC: Iceland representing poleward populations, UK: United Kingdom representing central populations, SP: Spain representing equatorward populations. Red stars represent sampling sites.
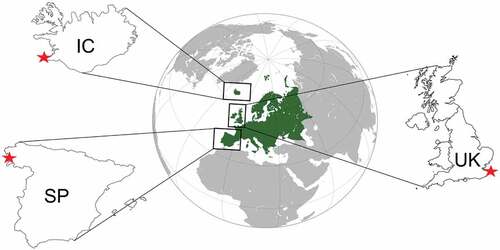
Table 1. Maximum (Max) and minimum (Min) temperature (°C) and light irradiance (µmol photons m–2 s–1) (mean ± SD) in summer and winter measured by data logger deployment next to the sampling sites in the respective region. Highest variability (Δ) for each sampling location, measured as difference between the maximum summer and the minimum winter temperatures.
Table 2. Ambient sampling details (mean ± SD): atmospheric pressure, pH, dissolved oxygen (DO), salinity, temperature and irradiance, as well as daylight hours and weather conditions across Corallina officinalis distribution in the North-east Atlantic. Data represent point measurements during sample collection at different sampling occasions over a four-year period.
Fig. 2. Data logger records of temperature (°C) and light intensity (irradiance; μmol photons m–2 s–1) at northern sites of Corallina officinalis distribution in the North-east Atlantic, Iceland, between July and October 2017. Light intensity is represented as yellow line and temperature is represented as the in situ records in the multiple-colour line. Temperatures above 20°C and below 10°C are coloured in red and blue, respectively.
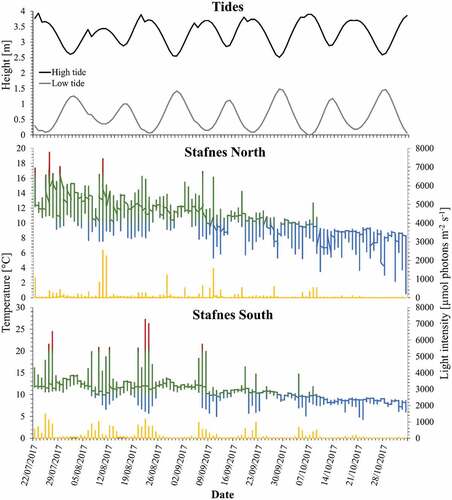
Fig. 3. Data logger records of temperature (°C) and light intensity (irradiance; μmol photons m–2 s–1) at central sites of Corallina officinalis distribution in the North-east Atlantic, UK, between January 2017 and March 2018. Light intensity is represented as a yellow line and temperature is represented as the in situ records in the multiple-colour line. Temperatures above 20°C and below 10°C are coloured in red and blue, respectively. Grey areas mark time periods not directly comparable with the other locations, but data loggers continued recording.
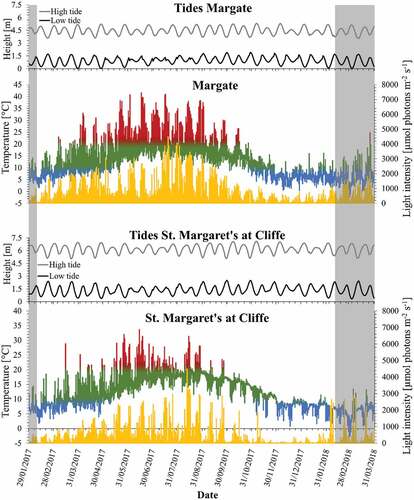
Fig. 4. Data logger records of temperature (°C) and light intensity (irradiance; μmol photons m–2 s–1) at southern sites of Corallina officinalis distribution in the North-east Atlantic, Spain, between February 2017 and July 2018. Light intensity is represented as a yellow line and temperature is represented as the in situ records in the multiple-colour line. Temperatures above 20°C and below 10°C are coloured in red and blue, respectively. Grey areas mark time periods not directly comparable with the other locations, but data loggers continued recording.
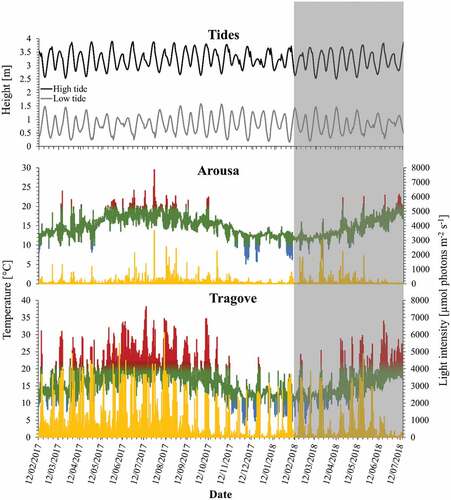
Fig. 5. In situ temperature (°C) and light intensity (irradiance; µmol photons m–2 s–1) before noon-incubations across sites (mean ± SE, n = 2 per latitudinal region) of Corallina officinalis in the North-east Atlantic. Chequered and solid bars represent temperature and light intensity, respectively. Coloured bars represent individual regions.
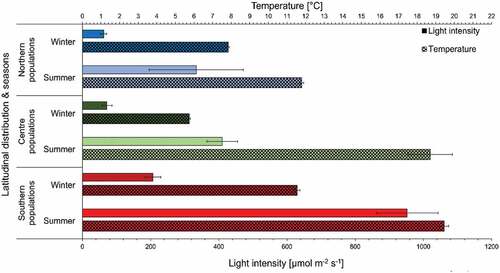
Fig. 6. Primary production and dark respiration rates (µmol O2 h−1 gDW−1) mean ± SE (n = 10) of in situ incubations of Corallina officinalis across its distribution in the North-east Atlantic in summer and winter. Pmax added for comparison.
Fig. 7. Seasonal daily production (left) and calcification (right) rates (mean ± SE) of northern (blue), central (green) and southern (red) populations (n = 2) of Corallina officinalis in summer (light colours) and winter (dark colours).
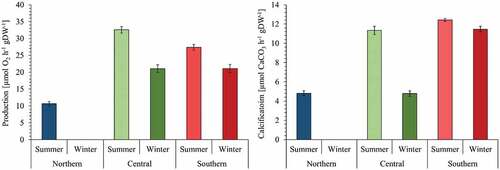
Fig. 8. Light and dark calcification rates (µmol CaCO3 h–1 gDW–1) mean ± SE (n = 10) of in situ incubations of Corallina officinalis across its distribution in the North-east Atlantic in summer and winter. Gmax added for comparison.
Fig. 9. Evolution curve characteristics for production and calcification (mean ± SE, n = 10) of northern, central and southern populations (n = 2; n = 5 per population) of Corallina officinalis in summer and winter. (A): Pmax/Gmax = maximum production, (B) α = initial slope as indicator for photosynthetic or calcification efficiency, (C) IK = saturating irradiance. For detailed graphs: Fig. S1 (A–M), Fig. S5.
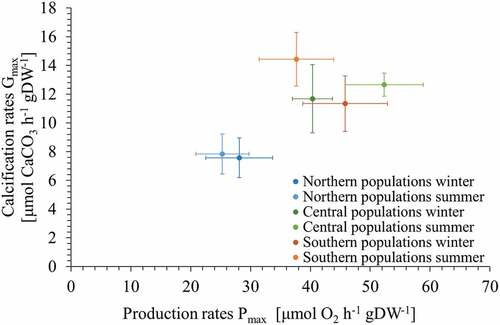
Fig. 10. Seasonal production versus calcification rates (mean ± SE) of northern (blue), central (green) and southern (red) populations (n = 2) of Corallina officinalis in summer (light colours) and winter (dark colours).