Figures & data
Figure 1. Homology model of the mouse IMINO transporter. The I-TASSER server was used to produce a homology model of the IMINO transporter. (A) Depicted is the backbone of the peptide-chain, secondary structures are emphasized. (B) The model contained the canonical transmembrane helices and cavities that matched predicted binding sites for sodium ions and proline. These entities were built into the model on the basis of Na+ and leucine binding to LeuT. Na+-binding site 1 is highly conserved, while Na+-binding site 2 shows less conservation. A further cavity, not found in LeuT, was observed that was lined with hydrogen bond donors. This was interpreted as the chloride binding site. A chloride ion was placed in this space.
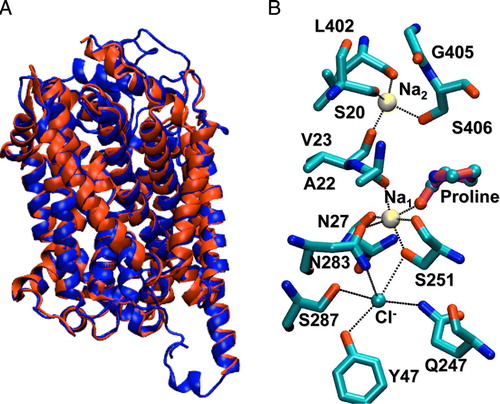
Figure 2. Structural alignment of IMINO and LeuT. The homology model was generated as described in the methods section. The resulting sequence alignment is shown. Fully conserved residues are indicated by an asterisk and similar residues are indicated by a dot. Residues on a grey background are involved in Na+1-binding. Residues on a black background are involved in Na+2-binding. Bold letters indicate residues involved in Cl− binding. Transmembrane helices are underlined and numbered.
Figure 3. Proline uptake and currents of wild type and IMINO mutants. (A) and (C): Oocytes were injected with cRNA (20 ng) encoding wild type or mutant IMINO transporters. After an incubation period of 4 days, uptake of 100 µM [14C]proline was measured over an incubation period of 20 min. Each bar represents the mean±SD of 10 oocytes; the experiment was repeated three times with similar results. Wild-type activity ranged from 140–180 pmol/20 min per oocyte. (B) and (D): After an incubation period of five days oocytes were superfused with 1mM proline in the presence or absence (NMDG-Cl) of Na+ and the resulting currents were recorded (n=7 for each mutant, the experiment was performed with three independent batches of oocytes, wild-type currents were in the range of 50–150 nA).
![Figure 3. Proline uptake and currents of wild type and IMINO mutants. (A) and (C): Oocytes were injected with cRNA (20 ng) encoding wild type or mutant IMINO transporters. After an incubation period of 4 days, uptake of 100 µM [14C]proline was measured over an incubation period of 20 min. Each bar represents the mean±SD of 10 oocytes; the experiment was repeated three times with similar results. Wild-type activity ranged from 140–180 pmol/20 min per oocyte. (B) and (D): After an incubation period of five days oocytes were superfused with 1mM proline in the presence or absence (NMDG-Cl) of Na+ and the resulting currents were recorded (n=7 for each mutant, the experiment was performed with three independent batches of oocytes, wild-type currents were in the range of 50–150 nA).](/cms/asset/ee9cd9d4-4484-417d-b04a-0650f4a095eb/imbc_a_415175_f0003_b.gif)
Figure 4. Surface expression of IMINO mutants. IMINO wild type and its site-specific mutants were cloned into an N-terminal EGFP fusion vector. Subsequently, all constructs were amplified by PCR, transcribed in vitro and expressed in oocytes. Surface localization was analysed by confocal microscopy after five days of expression. The laser light does not penetrate the oocyte; as a result only transporters at the surface are excited and show fluorescence (n=7 for each mutant, the experiment was performed with 2–3 independent batches of oocytes).
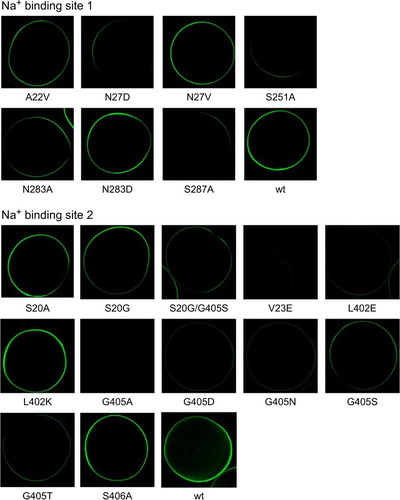
Figure 5. Activation of proline-induced currents by sodium ions. Oocytes were injected with wild type, A20V and S20A IMINO cRNA. After an incubation period of five days oocytes were superfused with 0.5 mM proline in the presence of Na+ ranging from 1–30 mM and the resulting currents were recorded. The left scale is used for wild-type currents, the right scale for the two mutated transporters. Each datapoint represents the mean±SEM of n=7 oocytes. The experiment was repeated with two independent batches of oocytes.
Table I. Changes of the K0.5 for Na+ associated with mutations in Na+-binding sites. Oocytes were injected with cRNA (20 ng) encoding the IMINO transporter. After an incubation period of 4 days, uptake of 100 µM [14C]proline was measured over an incubation period of 15 min at different Na+ concentrations. LiCl or NMDG-Cl was used to replace Na+ as indicated in the table. The number of independent experiments (e) used to derive the K0.5 is indicated.
Figure 6. Current-voltage relationships for IMINO wild type and mutants A20V and S20A. Current-voltage relationships were recorded in Na+-containing ND96 buffer or in modified ND96 in which Na+ was replaced by LiCl or Na-gluconate (NaGlc) in oocytes expressing wild-type IMINO (A) or its mutants S20A (C) and A22V (D). To compare substrate-induced currents in the wild type and its mutants, currents at a holding potential of −50 mV are depicted on an interrupted scale (B). All measurements show the mean of three experiments with n > 8 oocytes each.
Figure 7. Na+-dependent leak currents in the IMINO transporter. Oocytes were injected with wild type or mutant IMINO cRNA (20 ng). After an incubation period of five days oocytes were superfused with ND96 (96 mM Na+) or modified ND96 in which NaCl was replaced by NMDG-Cl in the absence of substrate. The difference of the holding current is depicted. (A) Outward current as a function of the difference of the Na+-concentration in the bath (n=19). (B) Comparison of the outward current between wild-type, mutants and non-injected oocytes (n=7).
Figure 8. Chloride cotransport and electrogenicity of the IMINO transporter. Oocytes were injected with 20 ng IMINO cRNA. (A) After an incubation period of five days uptake of 36Cl− (grey bars) and [14C]proline (black bars) was measured over a period of 30 min in the presence (100 mM) and the nominal absence (low) of Na+ (NMDG replacement) and the amount of both isotopes was determined in individual oocytes by dual-label scintillation counting. The 36Cl− preparation contained significant amounts of Na+, which can be estimated from the difference of 36Cl− and [14C]proline uptake in the wild type versus the N27V mutant. (B) Uptake of 100 µM [14C]proline was performed under voltage-clamp and current clamp (cc) conditions over a period of 10 min and the amount of accumulated amino acid was determined by liquid scintillation counting.
![Figure 8. Chloride cotransport and electrogenicity of the IMINO transporter. Oocytes were injected with 20 ng IMINO cRNA. (A) After an incubation period of five days uptake of 36Cl− (grey bars) and [14C]proline (black bars) was measured over a period of 30 min in the presence (100 mM) and the nominal absence (low) of Na+ (NMDG replacement) and the amount of both isotopes was determined in individual oocytes by dual-label scintillation counting. The 36Cl− preparation contained significant amounts of Na+, which can be estimated from the difference of 36Cl− and [14C]proline uptake in the wild type versus the N27V mutant. (B) Uptake of 100 µM [14C]proline was performed under voltage-clamp and current clamp (cc) conditions over a period of 10 min and the amount of accumulated amino acid was determined by liquid scintillation counting.](/cms/asset/010b4662-90dd-4dcd-97ef-236d283f202d/imbc_a_415175_f0008_b.gif)
Table II. Accumulation of [14C]proline in oocytes expressing the mouse IMINO transporter. Oocytes were injected with cRNA (20 ng) encoding the IMINO transporter. After an incubation period of 4 days, uptake of 25 M [14C]proline was measured over an incubation period of 5 hours. Each experiment (columns wt, S20A and A22V) shows the mean observed accumulation of n=10 oocytes each in ‘e’ experimental repeats. These values are compared to accumulation ratios predicted by models 1–5. Cotransported Cl− are preceded by a /, Cl− undergoing exchange are shown in brackets followed by X.
Figure 9. Modelling of the Iminoglycinuria associated mutation T199M. (A) Depiction of the spatial arrangement of T199 and M401 in the IMINO transporter. The side-chain of T199 is in close contact with M401. M401 is located in helix 8 and is close to Na+2 (magenta) and the substrate proline (orange). The Na+1 is shown in blue. (B) Oocytes were injected with cRNA (20 ng) encoding wild type or mutant IMINO transporters. After an incubation period of 3 and 5 days, uptake of 100 µM [14C]proline was measured over an incubation period of 10 min. Each bar represents the mean±SD of 10 oocytes, the experiment was repeated three times with similar results.
![Figure 9. Modelling of the Iminoglycinuria associated mutation T199M. (A) Depiction of the spatial arrangement of T199 and M401 in the IMINO transporter. The side-chain of T199 is in close contact with M401. M401 is located in helix 8 and is close to Na+2 (magenta) and the substrate proline (orange). The Na+1 is shown in blue. (B) Oocytes were injected with cRNA (20 ng) encoding wild type or mutant IMINO transporters. After an incubation period of 3 and 5 days, uptake of 100 µM [14C]proline was measured over an incubation period of 10 min. Each bar represents the mean±SD of 10 oocytes, the experiment was repeated three times with similar results.](/cms/asset/d08ff5a2-5611-48ad-9717-371069933c41/imbc_a_415175_f0009_b.jpg)