Figures & data
Figure 1. Purification of TM-ACE, GPI-ACE and MDP. TM-ACE, GPI-ACE and MDP were purified as described in the Experimental section, analysed on a 7–17% polyacrylamide SDS gel and stained with Coomassie Brilliant Blue. The positions of the molecular weight markers (kDa) are shown.
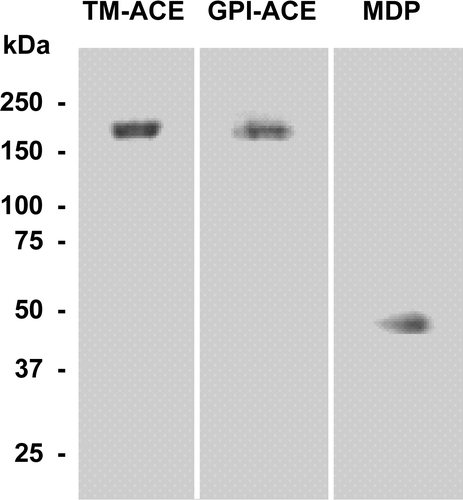
Figure 2. AFM images of supported lipid bilayers containing either egg, brain, palmitoyl or stearoyl sphingomyelin. Supported lipid bilayers composed of equimolar sphingomyelin, DOPC and cholesterol were imaged in fluid using tapping mode AFM. Surface images of bilayers containing (a) egg sphingomyelin, (b) brain sphingomyelin, (e) palmitoyl sphingomyelin or (f) stearoyl sphingomyelin. (c), (d), (g) and (h) cross-sections of images in (a), (b), (e) and (f), respectively, at the lines indicated. The arrows indicate a height difference of ∼0.7 nm between the phases in all the lipid bilayers. All images are 5 µm scans with 10 nm height scale. Bar = 1 µm.
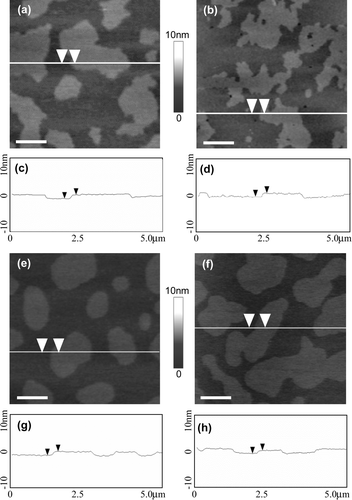
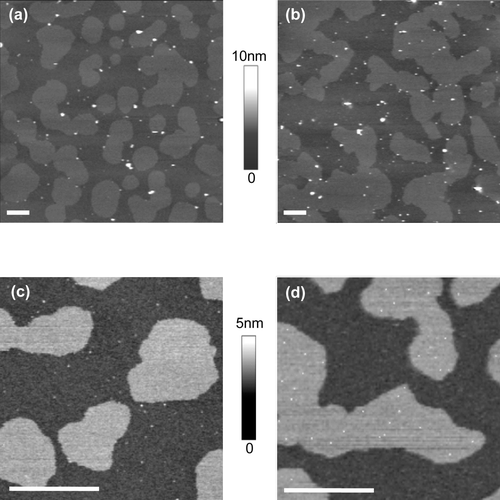
Figure 3. Distribution of TM-ACE and GPI-ACE in supported lipid bilayers. Supported lipid bilayers of equimolar sphingomyelin, DOPC and cholesterol containing either TM-ACE or GPI-ACE were imaged in fluid using tapping mode AFM. (a) TM-ACE in bilayers containing egg sphingomyelin; the protein is almost exclusively located in ld non-raft regions. (b) TM-ACE in bilayers containing brain sphingomyelin; TM-ACE is excluded from the lo raft domains. (c) GPI-ACE in bilayers containing egg sphingomyelin; the protein is confined to ld non-raft regions. (d) GPI-ACE in bilayers containing brain sphingomyelin; 38% of the protein is located in lo rafts. All images are 10 µm scans with 10 nm height scale. Bar = 1 µm.
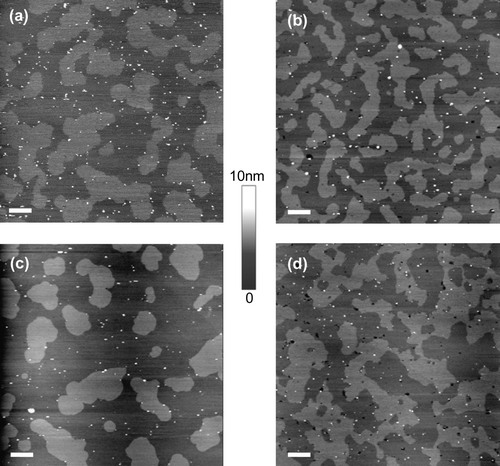
Table I. Statistical analysis of the distribution of proteins located in lo rafts.
Figure 4. Distribution of MDP in supported lipid bilayers. Supported lipid bilayers of equimolar sphingomyelin, DOPC and cholesterol containing MDP were imaged in fluid using tapping mode AFM. (a) MDP in bilayers containing egg sphingomyelin; the protein is almost exclusively located in ld non-raft regions. (b) MDP in bilayers containing brain sphingomyelin; the protein is almost exclusively located in lo raft domains. All images are 2.5µm scans with 5nm height scale. Bar = 1 µm.
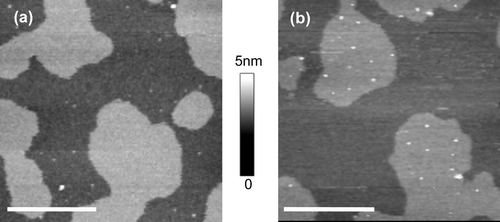
Figure 5. Distribution of GPI-ACE and MDP in supported lipid bilayers containing either palmitoyl or stearoyl sphingomyelin. Supported lipid bilayers composed of equimolar sphingomyelin, DOPC and cholesterol were imaged in fluid using tapping mode AFM. (a) GPI-ACE in bilayers containing palmitoyl sphingomyelin; the protein is confined to ld non-raft regions. (b) GPI-ACE in bilayers containing stearoyl sphingomyelin; 46.3% of the protein is located in lo rafts. (c) MDP in bilayers containing palmitoyl sphingomyelin; the protein is almost exclusively located in ld non-raft regions. (d) MDP in bilayers containing stearoyl sphingomyelin; the protein is predominantly (91.2%) located in lo raft domains. Images (a) and (b) are 10 µm scans with 10 nm height scale. (c) and (d) are 2.5 µm scans with 5 nm height scale. ?Bar = 1 µm.