
Figures & data
Figure 1. Achievement levels for preschool/kindergarten tests according to the old (bottom) and new (top) distributions, as depicted in the Cito LOVS. Colours vary according to the software used
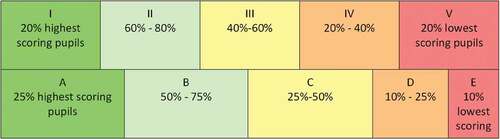
Figure 2. Timeline of the study procedure, date format dd-mm-yyyy
Table 1. General information on interview participants, percentiles are indicated by Pi.
Table 2. Main coding themes related to the preschool/kindergarten Cito tests
Figure 3. Graphic representation of the main co-occurrences and clusters. Each box represents a separate code. Solid lines indicate co-occurrences reported by at least two teachers. Dashed lines indicate connections that occurred frequently, but not for a particular teacher
Exploratory Mokken scale analysis with item H coefficients for the two scales